 Marina Lyubimova
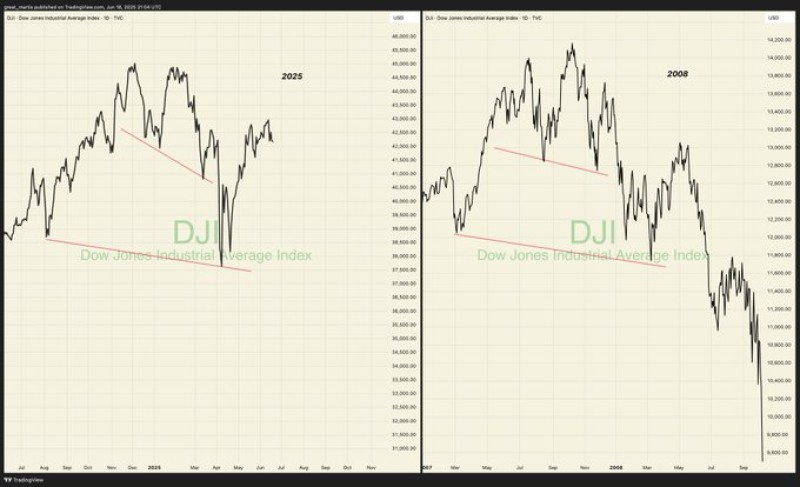
A striking chart comparison posted on X has traders on edge, showing the Dow Jones Industrial Average following a disturbingly similar pattern to the 2008 financial crisis. The current index levels between 38,700 and 40,600 are mirroring the technical setup that preceded one of the worst market crashes in modern history.
Dow Jones 2025 vs 2008: Alarming Pattern Emerges
The viral chart comparison reveals an eerie visual similarity between today's market structure and the pre-crash conditions of 2008. Both timeframes show a classic double-top formation followed by a steep decline, temporary recovery, and warning signs of another potential leg down.
Back in 2008, the DJI plummeted from around 13,000 to under 8,000, triggering the Great Recession. Now, with the index trading in the 38,700–40,600 range, market watchers are asking whether history might repeat itself. While past performance doesn't guarantee future results, this pattern similarity has grabbed serious attention from technical analysts.
DJI Crash Signal: Real Threat or Market Noise?
The X post carries a bold "CRASH WARNING🛑" headline, urging traders to "study carefully" – suggesting the author sees genuine risk ahead. If the Dow Jones follows its 2008 playbook, we could witness a breakdown below critical support levels, potentially sending the index tumbling from its current 39,000+ territory.
But not everyone's buying into the doom scenario. Some market experts point out that today's economic fundamentals are far stronger than the shaky foundation that existed before 2008. The banking system is more stable, regulations are tighter, and corporate balance sheets are generally healthier.
Still, the technical setup is hard to ignore. The Dow Jones Industrial Average sits at a crucial inflection point around 38,700–40,600, and the next few trading sessions could determine whether this pattern recognition is just a spooky coincidence or a legitimate warning signal.
The bottom line? While chart patterns alone don't crash markets, they often reflect underlying sentiment and positioning. Whether you're a believer in technical analysis or not, this comparison has amplified caution among traders watching the Dow Jones (DJI) hover near 39,000 – and that heightened awareness alone could influence market behavior in the coming weeks.
 Marina Lyubimova


