 Usman Salis

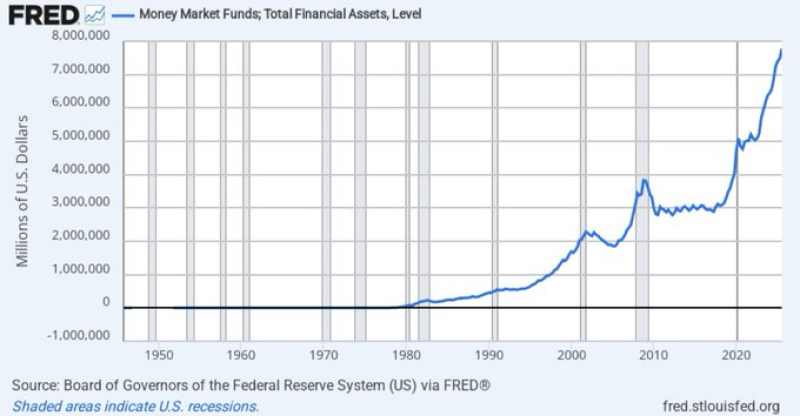
⬤ U.S. Money Market Funds have climbed to around $7.8 trillion in total assets, according to Federal Reserve FRED data. This is essentially "parked" capital sitting in cash-like instruments at a moment when rate expectations are driving every major market conversation. The long-run chart tells a clear story: balances grew steadily for decades, then surged after 2020 and have kept climbing to fresh highs.
⬤ Money market funds tend to swell when short-term yields are attractive or when investors simply want to stay liquid without taking on risk. At $7.8 trillion, that pool is large enough that even a modest shift in sentiment becomes a macro event. With U.S. bank reserves already dropping below $3 trillion, the concentration of cash in money markets looks even more striking by comparison.
Even a 1% to 2% shift from a $7.8 trillion base would imply roughly $75 billion to $150 billion moving elsewhere.
⬤ That math is exactly why analysts are watching this space so closely. If rates keep falling, cash returns compress and the "park it and wait" strategy becomes less attractive. The rotation playbook looks something like this: cash into equities first, then into higher-risk segments as confidence builds. A 1-2% reallocation alone could send $75-150 billion flowing into markets - a number big enough to move things. Fed cut expectations are already rising, which makes the timing of that shift a live debate.
⬤ Ultimately, U.S. Money Market Funds sit at the crossroads of policy, liquidity preference, and risk appetite. Whether or when $7.8 trillion starts moving is the question markets are trying to answer. The conditions that kept this capital on the sidelines are starting to shift - and when flows change, they tend to move fast across asset classes.
 Usman Salis


