 Saad Ullah
There's a growing gap between what official government data says about inflation and what real-time trackers are seeing. And ahead of the next PCE release, that gap is hard to ignore.
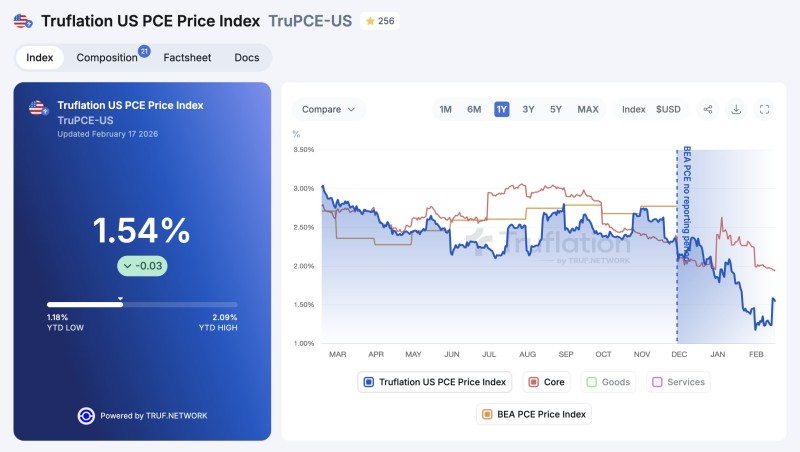
The US Personal Consumption Expenditures Price Index is currently sitting at 1.54%, with core PCE — which strips out food and energy — running close to 1.94%. That's a significant drop from the 2.8% official reading the Bureau of Economic Analysis posted back in November 2025, with the next BEA report scheduled for February 20.
The Truflation chart tells a clear story: prices have been trending steadily lower in recent months, falling well below the 2.5%–3.0% range seen earlier. Year-to-date, the index has moved between roughly 1.18% and 2.09% — signaling a genuine cooling in price pressure, at least in real time. That aligns with what bond markets have been hinting at too, as covered in US 10-year Treasury hits yearly low as rate cut expectations grow.
Why the PCE Gap Matters for Rate Expectations
Core PCE is the Fed's preferred inflation gauge for a reason — it captures persistent price pressure better than headline CPI. So when real-time readings drop this far below official figures, it raises a natural question: will the government's next report catch up?
If the February 20 release confirms what Truflation is already showing, it could reinforce expectations for rate cuts — especially with refinancing pressures building in the background, as highlighted in US debt $9.6T maturing in 2026 puts focus on rates and policy.
What to Watch in the February 20 BEA Release
A reading that converges toward the real-time 1.54% level would confirm the disinflation trend and give the Fed more room to ease. A surprise to the upside, however, could reignite uncertainty around the inflation outlook and push back rate cut timelines.
Either way, the divergence between real-time and official data is worth tracking — because right now, the two are telling very different stories.
 Saad Ullah


