 Marina Lyubimova
⬤ The Dow Jones Industrial Average is catching a break as inflation dynamics shift. The NDR Inflation Timing Model just turned negative, and that's actually good news. Looking at CPI trends compared to the model's readings since the mid-2000s, we can see how inflation has evolved and where it's headed now.
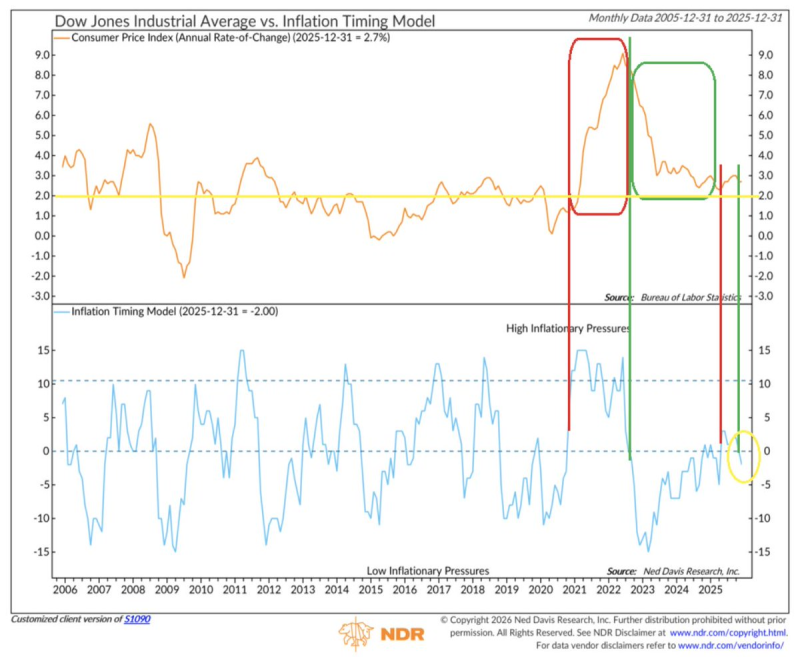
⬤ Back between 2020 and early 2022, the model lit up red as inflation took off. CPI readings shot well above historical averages during this period, and the model caught it early. This was when inflation became the topic everyone couldn't stop talking about, and for good reason—prices were climbing fast across the board.
The model clearly identified the sharp rise in inflation from 2020 through early 2022, a period marked by rapidly accelerating consumer price growth.
⬤ Then came the turnaround. In late 2022, the model shifted lower and accurately called the disinflation phase. CPI momentum cooled throughout 2023 and 2024, and by the end of 2025, the model dropped below zero. Historically, when this happens, it means inflation pressure is genuinely easing rather than just taking a breather before another surge.
⬤ Why does this matter? Because inflation trends drive everything from Fed decisions to market sentiment. While no rate cut is expected in January, a negative model reading opens the door for softer Fed messaging down the line. For the Dow and broader equity markets, easing inflation means less volatility and clearer expectations about where monetary policy is headed—and that's exactly what investors want to see right now.
 Marina Lyubimova


