 Usman Salis

Energy shocks are often associated with economic slowdowns, but the data tells a more uneven story. As Seth Golden highlighted, a scenario involving a $40 increase in oil prices and a 50% rise in natural gas historically shows no impact on U.S. GDP - while inflation rises meaningfully across major economies.
A Clear Divide Between Energy Shock Growth and Inflation Impact
The chart illustrates a consistent divergence: GDP responses vary widely, while CPI increases across all regions without exception.
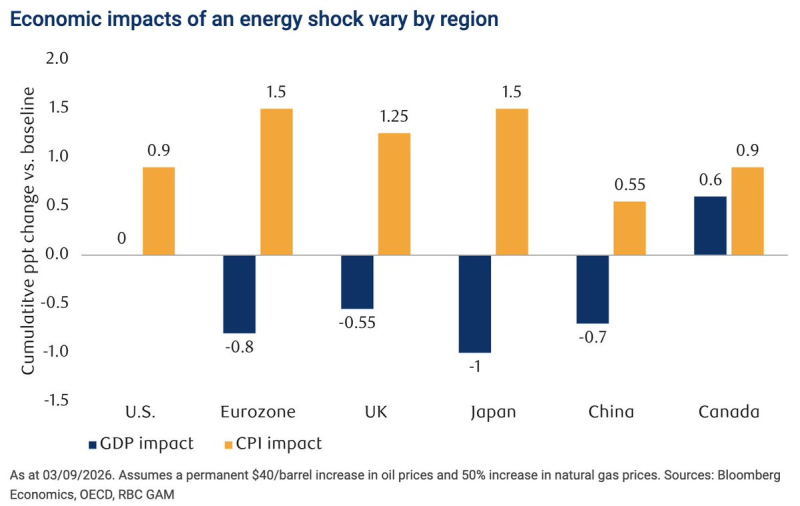
In the U.S., GDP impact is shown at 0.0 while CPI rises by approximately 0.9 percentage points - economic output remains stable despite rising energy costs. In contrast, other regions experience both higher inflation and negative growth effects:
- U.S.: GDP ~0.0, CPI ~+0.9
- Eurozone: GDP ~-0.8, CPI ~+1.5
- UK: GDP ~-0.55, CPI ~+1.25
- Japan: GDP ~-1.0, CPI ~+1.5
- China: GDP ~-0.7, CPI ~+0.55
- Canada: GDP ~+0.6, CPI ~+0.9
Canada is the only region with a positive GDP response - while Europe and Japan appear most sensitive to growth contraction, reflecting how differently energy-producing and energy-importing economies absorb the same shock.
Canada stands out as the only region with a positive GDP response alongside rising inflation, while Europe and Japan appear most sensitive to growth contraction under rising energy costs.
Regional Sensitivity to CPI Energy Shocks Varies Sharply
The asymmetry in GDP responses reflects each economy's underlying energy mix, import dependency, and structural exposure to commodity prices. The U.S. benefits from domestic production capacity that cushions growth even as consumer prices rise. Japan and the Eurozone, by contrast, are heavily import-dependent - making them far more vulnerable to the same shock.
GDP effects differ by region - but CPI increases remain the common thread across every major economy in the chart, regardless of whether growth holds, falls, or rises.
Brent Oil Up 67% in 2026, Yet Real Prices Stay Near 25-Year Average adds important context here, showing how the magnitude of the current energy move compares to historical episodes - and why the inflation response may be more muted than headline price gains suggest.
Inflation Emerges as the Universal Energy Shock Outcome
What ties all regions together is the consistent increase in CPI. Regardless of whether GDP falls, holds steady, or rises, inflation responds upward in every case presented. That consistency is the chart's most important signal - energy shocks may not uniformly hurt growth, but they uniformly feed into prices.
WTI Crude Oil Crashes 12% After Strategic Reserve Shock shows how quickly energy price dynamics can reverse under policy intervention - a reminder that the inflation impact modeled in the chart depends heavily on how long the shock persists. U.S. Inflation Outlook: Truflation Sees Slightly Softer Data Ahead of Official CPI tracks how real-time inflation data is currently evolving against that backdrop, adding a forward-looking dimension to what the historical model shows.
The chart's message is precise: energy shocks do not produce a uniform economic outcome, but they do consistently produce an inflationary one - and that distinction matters for how different regions need to respond when the next shock arrives.
 Usman Salis


