 Saad Ullah

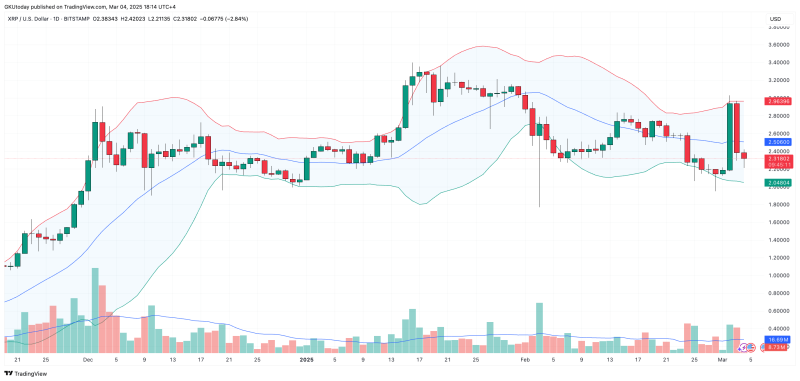
XRP experiences a significant price movement, with Bollinger Bands indicating a potential test of lower support levels around $2.04, suggesting increased market volatility for the cryptocurrency.
XRP's Sudden Price Surge and Subsequent Correction
The cryptocurrency market continues to demonstrate its characteristic volatility, with XRP (XRP) being a prime example of recent price dynamics. After a remarkable 34.27% spike on Sunday, the third-largest cryptocurrency encountered a notable price correction that has caught the attention of traders and analysts alike.
Examining the daily price chart reveals a fascinating pattern within the Bollinger Bands technical indicator. The token's price initially reached the upper band, triggering a swift downward movement that broke through the middle curve at $2.50. This technical behavior suggests a potential continuation of bearish momentum.
Bollinger Bands: A Magnet for Price Action
Bollinger Bands operate like a magnetic force in technical analysis, guiding price movements across different market conditions. In XRP's current scenario, the upper band appears to have instigated profit-taking and potentially panic-selling as the initial momentum began to stall.
The current market positioning shows XRP trading at $2.32, with indications pointing toward a possible test of the lower band at $2.04. This potential movement represents an additional 11% downside, highlighting the significant volatility in the cryptocurrency's short-term outlook.
Risk Management in Volatile Crypto Markets
While predicting exact market movements remains challenging, traders and investors must prepare for potential volatility. The Bollinger Bands suggest that XRP might be approaching a critical support level, which could trigger increased market activity and unpredictable price swings.
Traders should maintain a cautious approach, implementing robust risk management strategies to navigate the potential turbulence. The current technical setup indicates that the cryptocurrency might experience a brief dip or enter a more extended consolidation phase.
Technical Indicators and Market Sentiment
The recent price action of XRP demonstrates the complex interplay between technical indicators and market sentiment. The Bollinger Bands' current configuration suggests a bearish short-term outlook, with the potential for further downward pressure.
Investors and traders are advised to closely monitor the $2.04 support level, as a breach could signal additional selling pressure. Conversely, a strong bounce from this level might indicate underlying market strength and potential trend reversal.
As always, the cryptocurrency market remains highly unpredictable, and participants should approach trading with careful analysis and risk-aware strategies.
 Saad Ullah


