 Saad Ullah

⬤ XRP is closing in on a key technical decision zone where long-term trend lines are converging. The asset could perform a touch-and-go reaction near the $0.70 level before making a bigger directional move. The chart captures a multi-year compression structure that's now hitting its inflection point.
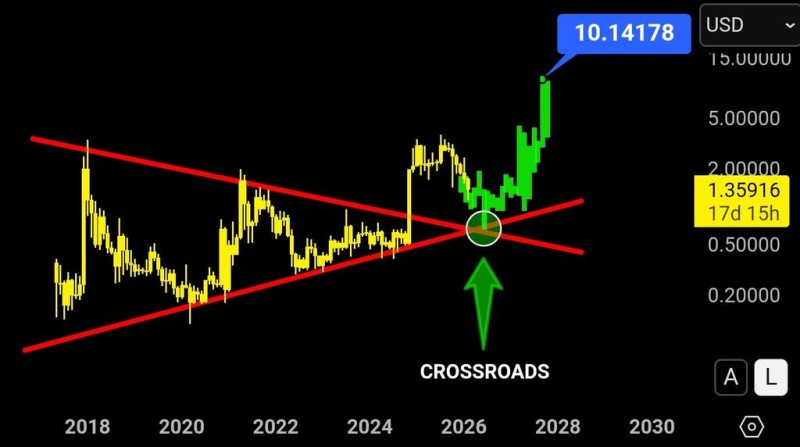
⬤ XRP has been moving inside a broad triangular range that stretches across multiple market cycles. The intersection area works as a structural pivot — historically, price reactions here decide whether the asset continues higher or loses momentum. Similar compression setups were recently covered in XRP Price Analysis: Triangle Squeeze Points to Monday Volatility.
⬤ The chart's projected trajectory points toward $10 if XRP reacts positively at the crossroads zone. Long-term breakout targets like this have been explored in XRP Price Analysis: Is an Explosive Breakout Ahead? and in XRP Price Analysis: Historical Patterns Signal Potential Rally.
⬤ How price reacts at this intersection could define XRP's next major cycle phase. Multi-year compression zones like this tend to act as turning points — the kind where prolonged consolidation gives way to a strong directional move in either direction.
 Saad Ullah


