Eseandre Mordi

XRP is once again testing a key technical barrier, but unlike the earlier breakout phase, the current structure shows a market still firmly under pressure. TheCryptoBasic noted that XRP has already retested a descending trendline twice this month and is now approaching a potential third interaction - repeated failures at resistance are shaping what comes next.
XRP Trendline Retest Mirrors Pre-Rally Setup
This mirrors the setup seen before the March rally, when multiple retests preceded a breakout toward $1.60.
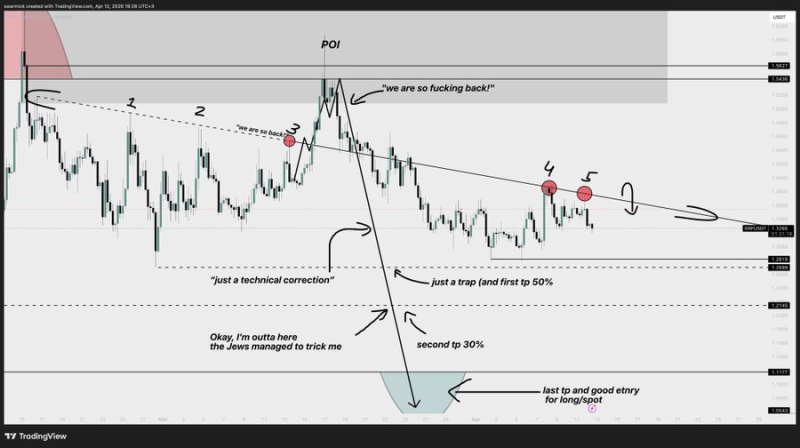
However, the current price action is unfolding after a sharp pullback. XRP has dropped more than 16% from that March high, and the broader structure continues to reflect a sustained downtrend that has been in place since late 2025.
Each rally attempt is being absorbed rather than extended, reflecting a market that respects its descending structure.
The chart shows XRP consistently trading below a downward-sloping trendline since mid-February, with each rally attempt failing at or near that resistance. Instead of building strength into the level, price is forming a sequence of lower highs and drifting sideways to lower beneath it.
Repeated XRP Rejections Reinforce the Ceiling
This type of structure typically signals continuation rather than reversal, especially when resistance is tested multiple times without a breakout. Similar descending channel behavior has been observed in broader XRP technical setups, where price repeatedly reacts to upper resistance boundaries before extending lower.
The key feature in the current chart is not just the trendline itself, but how price interacts with it. Each approach results in rejection, confirming it as an active ceiling rather than a weakening barrier:
- Multiple failed attempts to break above the trendline
- Lower highs forming beneath resistance
- Price unable to sustain upward momentum after each bounce
In the current structure, repeated trendline tests are reinforcing the downtrend rather than building pressure for a breakout.
This contrasts with earlier bullish phases, where repeated tests built pressure for a breakout. The weekly EMA retest setup offered a similar tension point - though conditions then were more favorable for bulls than what the chart currently reflects.
Third XRP Trendline Test May Decide the Next Direction
A third retest of resistance often becomes decisive. In bullish conditions, it can trigger a breakout. In bearish structures like this one, it more often confirms continued weakness.
A third retest of resistance in a bearish structure tends to confirm weakness rather than spark a reversal - unless momentum shifts decisively beforehand.
With XRP still trading below the trendline and lacking signs of strength into resistance, the setup suggests that another rejection remains the dominant scenario. Longer-term projections targeting $8.6 by late 2026 depend on a structural reset from current levels - but for now, the chart reflects a market where each rally attempt is being absorbed rather than extended.
 Eseandre Mordi