 Peter Smith

While much of the crypto market has been quiet lately, XRP is approaching a major technical turning point. After weeks of declining momentum, the token has returned to a key support zone around its 55-week exponential moving average (EMA)—a level that has historically triggered bullish reversals. Traders are watching closely to see if this retest sparks the next big move.
Testing a Critical Support Level
As suggested by @ChartNerdTA, the weekly chart shows XRP hovering near $2.50, sitting right on top of its 55-week EMA—the first time it's touched this line since Q4 2024. This blue moving average acts as dynamic support, often separating bullish from bearish phases on longer timeframes.
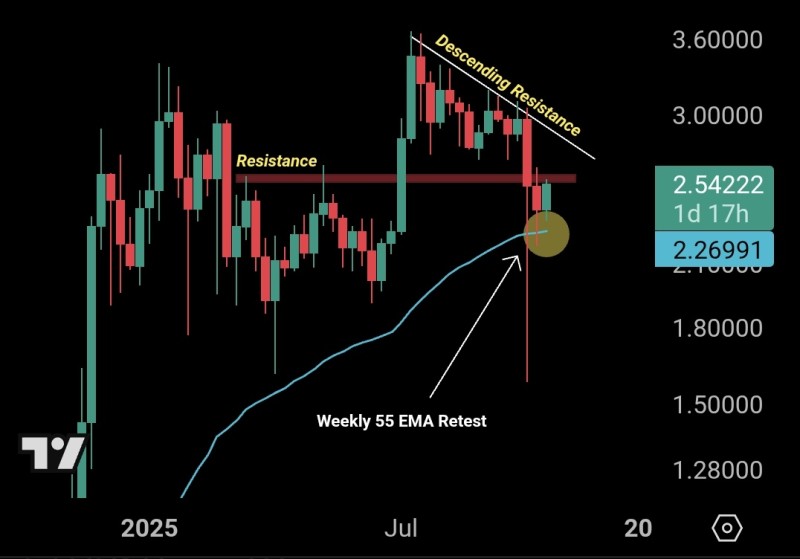
Above the current price, two key resistance zones are putting pressure on XRP. There's a horizontal band between $2.80 and $3.00 that stopped several rallies earlier this year, plus a descending trendline connecting lower highs since mid-2024. These levels have squeezed price action into a narrowing wedge—a pattern that typically precedes a sharp breakout once one side breaks.
The 55-week EMA has proven important for XRP before. When the price holds above it, accumulation tends to follow. Below it signals continued weakness and extended sideways movement. Beyond the technicals, Ripple's ongoing expansion in cross-border payments and CBDC pilots has kept investor confidence relatively stable despite recent price drops, adding fundamental backing to this technical setup.
What Happens Next
If XRP holds the $2.25–$2.50 support zone and breaks above that descending resistance line, the next target is $2.80–$3.00. A clean break above that could push XRP toward $3.20–$3.50, reclaiming ground lost in the recent correction. On the flip side, a close below $2.20 would likely extend the consolidation phase and send the token back into a lower range before any recovery attempt can gain traction.
 Peter Smith


