Usman Salis

⬤ XRP is showing a rare historical repetition on the macro timeframe. The asset has now produced five consecutive red monthly candles - exactly the same sequence that occurred between October 2016 and February 2017 before the explosive March-May rally began.
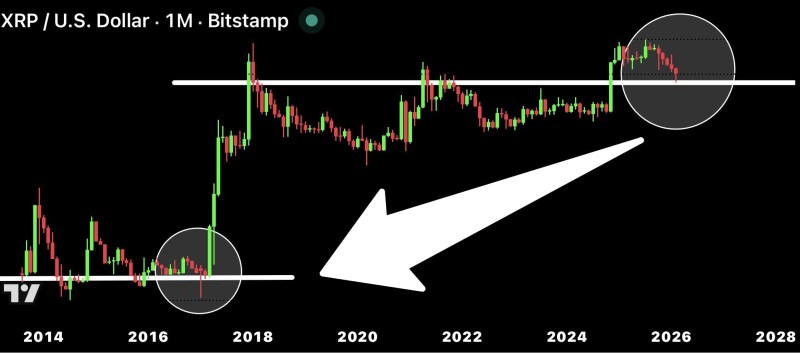
⬤ The monthly chart highlights a prolonged consolidation range where XRP repeatedly interacts with a long-term horizontal support zone. During the previous cycle, price compressed in a similar structure before breaking out aggressively. The current formation shows the same positioning inside the range after a failed breakout and pullback, emphasizing timing alignment rather than short-term volatility. Comparable market expectations surrounding a potential breakout were discussed in T Rowe Price files for $18T active crypto ETF including XRP Feb 26 decision expected.
⬤ The 2017 expansion started immediately after the fifth red candle sequence completed. The present chart mirrors both the candle count and market positioning within the macro channel. As one analyst noted, "The structural alignment between these two periods is remarkably precise - same candle pattern, same range behavior, same support interaction." Similar recovery behavior has been observed in XRP price shows signs of recovery after months long decline.
⬤ This pattern matters because repeating multi-year structures often influence market sentiment cycles. If historical rhythm continues to align with previous behavior, the coming months may determine whether XRP transitions from consolidation into expansion within its long-term trend.
 Usman Salis