 Marina Lyubimova

⬤ XRP has been sliding since hitting $1.93 on January 28, now trading around $1.59 within the golden pocket—a critical Fibonacci support zone between roughly $1.50 and $1.65. The pullback marks a continuation of the correction that's been unfolding for weeks, not a sudden collapse. Price is still holding above the lower boundary near $1.47–$1.50, which has kept further losses in check so far.
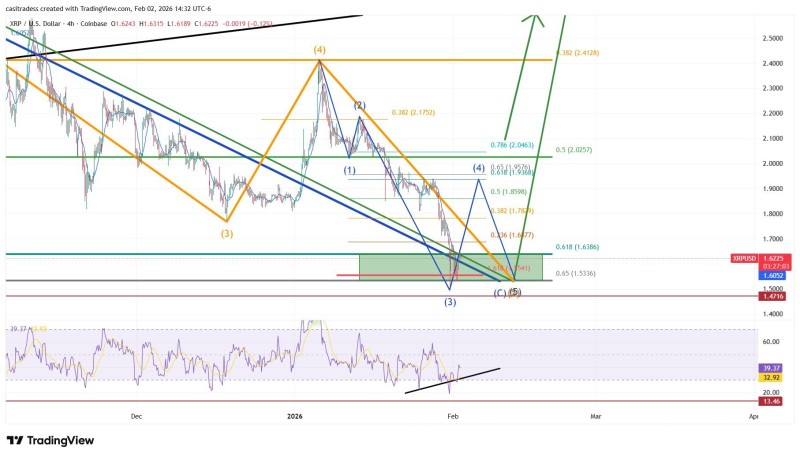
⬤ The 4-hour chart reveals XRP moving within a descending channel while settling into this golden pocket area. What's catching traders' attention is a bullish divergence forming on momentum indicators—basically, the selling force isn't confirming the recent price lows anymore. "The behavior suggests that bearish momentum may be losing strength after an extended decline," according to the technical analysis. For any real recovery to take hold, XRP needs to climb back above $1.78, a level that flipped from support to resistance.
⬤ What happens next hinges on whether XRP can defend this golden pocket zone. If it holds and pushes through nearby resistance, we could see sentiment flip bullish in the short term. But if support breaks, the token might drift lower or get stuck in a longer consolidation phase. With price sitting at a historically important Fibonacci level and momentum showing early signs of reversal, the next few trading sessions could determine where XRP heads from here.
 Marina Lyubimova


