Peter Smith

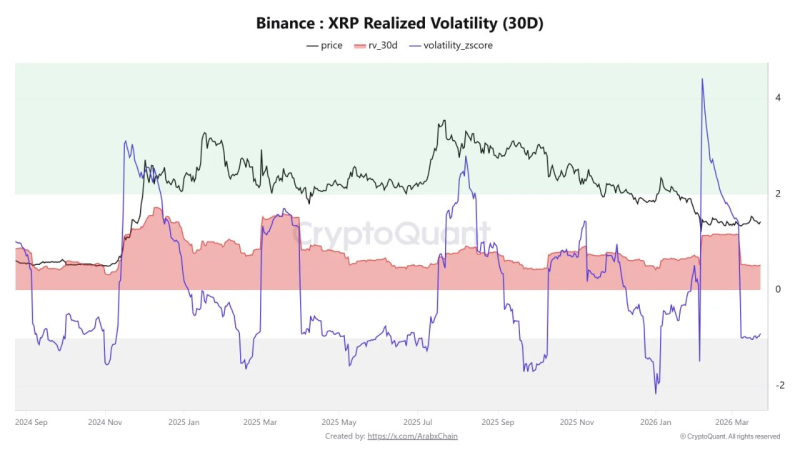
XRP is moving through a quiet stretch that traders often learn to watch closely. The coin's 30-day realized volatility on Binance has dropped to roughly 0.52 - the lowest reading of 2026 so far. CryptoQuant data confirms the pattern: price action has tightened, momentum has cooled, and the market appears to be holding its breath.
A 31% January Rally Followed the Last Compression - Will History Repeat?
History gives traders something to work with here. In January 2026, a nearly identical dip in realized volatility was followed by a 31% surge, with XRP climbing from $1.84 to $2.41 in just five days. That said, the pattern cuts both ways. In October 2025, a similar compression preceded a drop from $2.88 to $2.19. As analysts at XRP drops to $1.90 as volatility cools and market enters compression phase noted, tightening price action reflects reduced momentum - not direction.
Higher Lows and Bollinger Band Recovery Point to Buyer Accumulation
Beyond the volatility reading, a few other signals are aligning. Bollinger Bands and historical volatility metrics have started recovering after prior declines. XRP has also been printing higher lows - rising from around $1.10 in early February to approximately $1.36 in late March - a structure that typically reflects steady buyer support building beneath the surface. The XRP price analysis triangle squeeze points to volatility piece captured a similar setup, where narrowing price ranges pointed to an incoming expansion phase.
Taken together, these signals place XRP at a genuine inflection point. Whether the next move is up or down, something is building. The broader structure, outlined in XRP price forecast bullish wave structure holds, suggests long-term setups remain intact despite the short-term lull. Compression phases rarely last - and when they end, they tend to end decisively.
 Peter Smith