 Saad Ullah
⬤ XRP's price structure is catching eyes again as derivatives data shows serious liquidity piling up above the $3 mark. The long-term liquidation heatmap points to this overhead liquidity zone getting stronger. Binance's XRP/USDT heatmap backs this up visually, showing thick bands of liquidity sitting just above where the price is trading now.
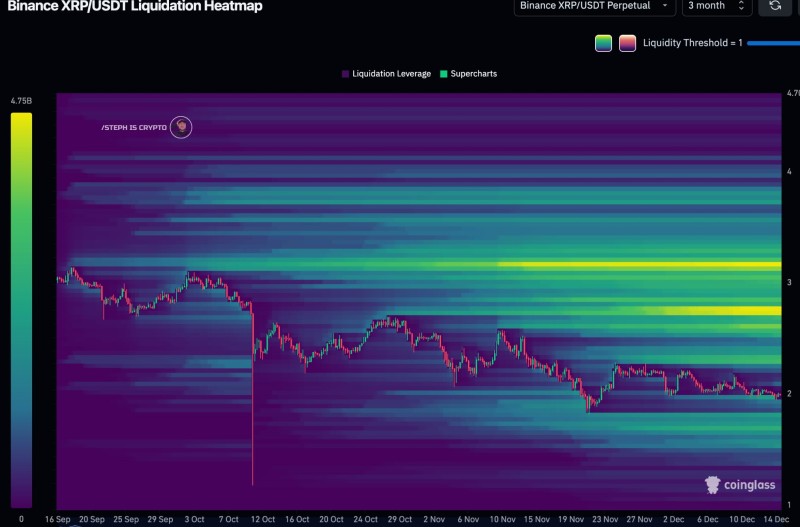
⬤ The heatmap paints a clear picture of how leveraged positions have stacked up over time. Brighter colors show where liquidation leverage is heaviest, and the biggest cluster sits right above $3. Meanwhile, liquidity below current levels looks pretty thin by comparison. This setup shows where a bunch of positions could get hit if the price pushes up into that zone. Since the heatmap covers several months, this isn't just a flash in the pan.
⬤ On the chart, XRP's been consolidating after a bigger drop and is still trading below that main liquidity cluster. These heatmaps don't predict which way price will move, but they do show where market pressure could spike once price gets close to areas packed with leverage. Right now, everything points to $3 as the key level to watch in XRP's price action, purely from a derivatives angle.
⬤ This matters because XRP is one of the most traded assets on perpetual futures platforms. When you've got big liquidity pools like this, they can really amp up volatility and mess with price behavior when momentum kicks in. That strengthening zone above $3 shows how derivatives are driving short-term market moves and proves that leverage and liquidation data have become essential tools for understanding where XRP and other digital assets might be headed next.
 Saad Ullah


