 Saad Ullah

⬤ XRP just hit a make-or-break moment after flashing a TD Sequential buy signal on the weekly timeframe. Everything hinges on whether XRP can hang onto the $1.90 level. Right now, the token's trading around $2.03, cooling off from recent highs after weeks of price pullback.
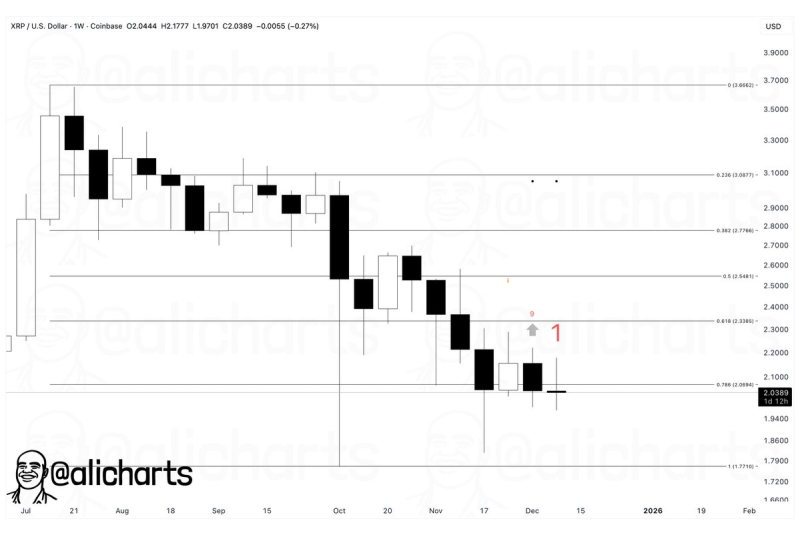
⬤ The weekly chart shows XRP sliding through multiple Fibonacci retracement zones, reflecting steady selling pressure following its earlier rally. Price is currently hovering just above the 0.786 retracement mark near $2.06—a zone traders often watch for possible stabilization. The TD buy signal hints that downward momentum might be losing steam, though there's no real confirmation unless support actually holds.
The setup depends entirely on whether XRP can hold the $1.90 level.
⬤ Looking at the chart, $1.90 stands out as the critical line in the sand. If XRP manages to stay above this zone, the current structure stays intact and opens the door to a potential run toward $2.50—a level that lines up with a previous price area marked on the chart. But if $1.90 breaks, the technical picture weakens considerably, raising the odds of further downside since there aren't many clear support levels below that point.
⬤ This setup carries weight because weekly signals typically matter more than short-term noise. How XRP behaves around $1.90 could set the tone for broader market sentiment as price consolidates near these key levels. With momentum slowing down and the structure tightening up, the next few weekly closes will likely determine where XRP heads next and how volatile things might get in the near term.
 Saad Ullah


