 Saad Ullah

While Bitcoin and Ethereum grab headlines, XRP is quietly doing something interesting—retracing the exact steps it took before its explosive rallies in 2017 and 2021. A long-term chart comparison reveals an almost eerie similarity between past and present market structures. The same consolidation patterns, the same support zones, and the same resistance levels are all back in play.
What the Charts Show
According to analyst EtherNasyonaL, XRP is "repeating history, but this time with a stronger version." The question is whether this setup will lead to the same explosive outcome.
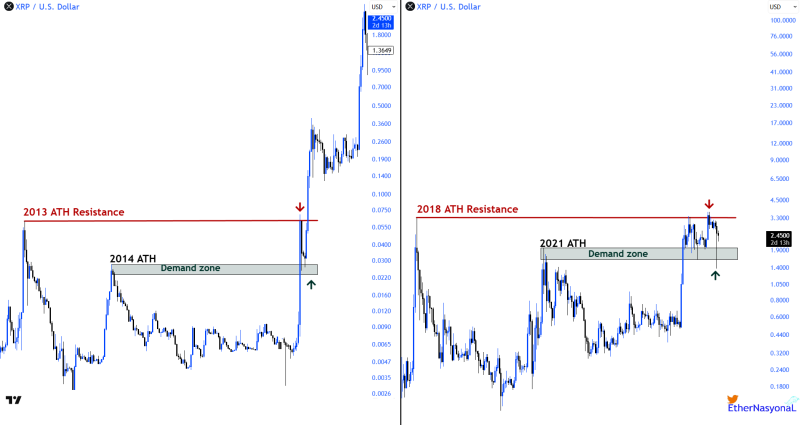
Comparing two distinct cycles reveals striking parallels. From 2013 to 2017, XRP spent years consolidating below its all-time-high resistance before a massive breakout pushed it from fractions of a cent to over $3.00. A strong support zone formed in 2014 that eventually became the launchpad for that rally.
Fast forward to today, and the structure looks remarkably similar. The 2018 all-time-high resistance around $3.30–$3.40 is acting as the same ceiling, while a demand zone between $1.80–$2.00 formed in 2021 is providing renewed support. Current price action near $2.45 shows XRP consolidating just above this critical area—the same technical setup that preceded previous parabolic moves. Both cycles show long periods of sideways accumulation followed by rapid vertical expansion, suggesting investor fatigue eventually gives way to explosive demand.
Several factors make this cycle potentially stronger than earlier ones. Ripple's partial legal victory against the SEC in 2024 has allowed XRP back onto major exchanges and into institutional portfolios, removing a massive regulatory overhang. Meanwhile, Ripple's expanding partnerships in cross-border payments and tokenized assets are driving actual utility beyond speculation. The broader macro environment is also more supportive—stabilizing inflation and improving risk appetite are bringing capital back into altcoins.
What Happens Next
If XRP breaks above $3.30, historical patterns suggest targets around $5.00–$6.50 using Fibonacci extensions. On the flip side, losing the $1.90–$2.00 support zone could mean more consolidation before any upward move. Right now, XRP sits in that familiar zone between boredom and breakout—but history shows these periods rarely last forever.
XRP's current chart is almost a carbon copy of its earlier cycles. The parallels between 2013–2017 and 2018–2025 suggest the asset is gathering strength below its historical ceiling once again. With clearer regulations, real-world adoption, and stronger fundamentals backing it this time, the setup looks even more compelling. Whether history repeats exactly or just rhymes, XRP's technical structure points toward potential long-term strength—a reminder that in cyclical markets, the quiet phases often hide the biggest moves.
 Saad Ullah


