Victoria Bazir
XRP is inching toward a critical inflection point on the weekly chart. The setup that's forming now closely mirrors what played out back in June 2022 - and for traders who remember that period, the implication is significant, according to analyst ChartNerd.
"The same structure is now forming again. The 20-week EMA is curling downward toward the 200-week EMA, closely mirroring the conditions seen before the 2022 bottom.
The signal in question is a 20/200-week EMA death cross. On paper, it sounds bearish. In practice, at least for XRP, it has a very different history.
The Death Cross That Called the Bottom
When XRP printed a 20/200-week EMA death cross in June 2022, most traders braced for further downside. Instead, that crossover landed at the exact cycle low. Price stabilized shortly after and began a broader recovery that extended well into the next cycle.
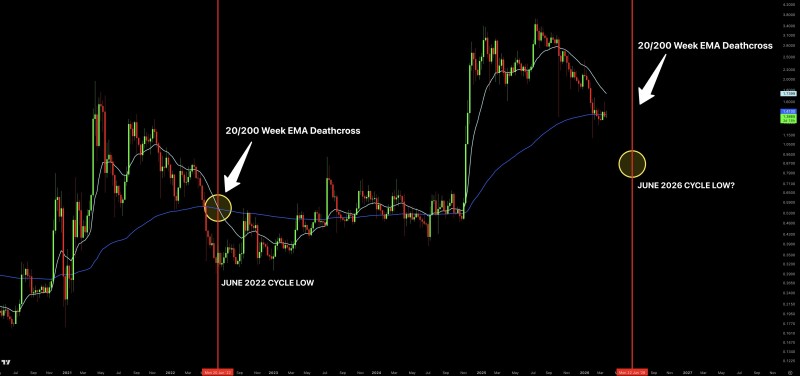
What made that moment notable wasn't just the signal itself - it was the timing. The crossover didn't lead the decline. It arrived after an extended move lower, functioning as a lagging confirmation that selling had exhausted itself rather than a warning of more to come. According to XRP price analysis from TheTradable, the asset has continued to respect structured patterns and long-term support zones during corrections.
A Familiar Setup Around the 200-Week EMA
The current chart shows XRP pulling back from recent highs and drifting toward the 200-week EMA, which is now acting as dynamic support. Price action has flattened out - not a clean breakdown, but not a healthy uptrend either.
Key structural elements visible on the chart:
- Price holding near the 200-week EMA after a sharp correction
- Lower highs forming after the recent peak, signaling fading momentum
- The 20-week EMA rolling over toward a potential bearish crossover
- Volatility compression as price stabilizes near support
This type of structure reflects a transition phase - not a confirmed breakdown, but a market losing upward momentum while searching for equilibrium.
This is the kind of setup that rarely stays unresolved for long. Either support holds and price reclaims short-term momentum, or it doesn't.
When History Starts to Rhyme
The resemblance between 2022 and today isn't just visual - it's structural. In both cases, XRP entered a late-stage correction followed by price flattening around the 200-week EMA. Long-term XRP cycle analyses have consistently pointed to this kind of consolidation near major support as a precursor to expansion moves.
If the death cross forms again in the June-July window highlighted on the chart, it could once again mark a macro bottom rather than signal further downside. That's the counter-intuitive read - and it's one supported by the asset's own historical behavior.
A Market Waiting for Resolution
XRP is now caught between two forces: a weakening short-term trend and a long-term support curve that's still intact. The 200-week EMA continues to hold as a structural floor, while the falling 20-week EMA reflects momentum that hasn't yet found a new direction.
If the current structure continues to mirror the 2022 pattern, the signal many traders fear could once again appear at the exact moment the market is preparing to turn.
Recent market cap projections for XRP ranging from $316B to $978B suggest that long-term bulls aren't writing off the current dip. For now, XRP remains in a transitional phase - and the next few weeks will likely determine whether history rhymes one more time.
 Victoria Bazir