 Saad Ullah

⬤ XRP is currently displaying price action that closely resembles previous breakdown structures after losing the 100-week EMA. Chart analyst @ChartNerdTA points out that historical moves below this critical level have consistently preceded significant declines, with the 2022 bearish cycle serving as the most recent example. Right now, XRP is rejecting the moving average and starting to drift lower in a pattern that looks strikingly familiar to those earlier setups.
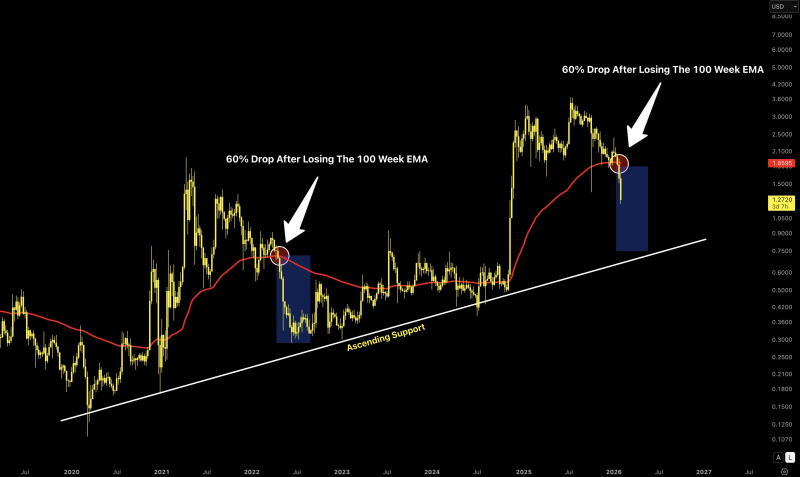
⬤ Looking back at the chart, you can see several instances where XRP experienced major drops after losing support at the 100-week EMA. The current situation shows a similar rejection playing out around this indicator, with downward momentum building after the recent interaction with the level. While the structural similarities are clear, it's worth noting that past patterns don't guarantee the same magnitude of movement this time around.
⬤ Below the current trading zone, there's an ascending support line that could become important if the weakness persists. This rising trendline has been a reference point during previous market reactions, making it a level worth watching as the structure continues to develop.
⬤ XRP now sits at a historically sensitive technical zone where previous breakdowns triggered extended downtrends. How price interacts with that ascending support line will likely shape what happens next in this broader pattern.
 Saad Ullah


