Usman Salis

⬤XRP/USD is trading inside a falling wedge on the weekly chart, with price squeezed between the 200-week EMA near $1.41 and the 20-week EMA resistance around $1.74. The setup reflects a tightening range that historically signals a potential inflection point ahead.
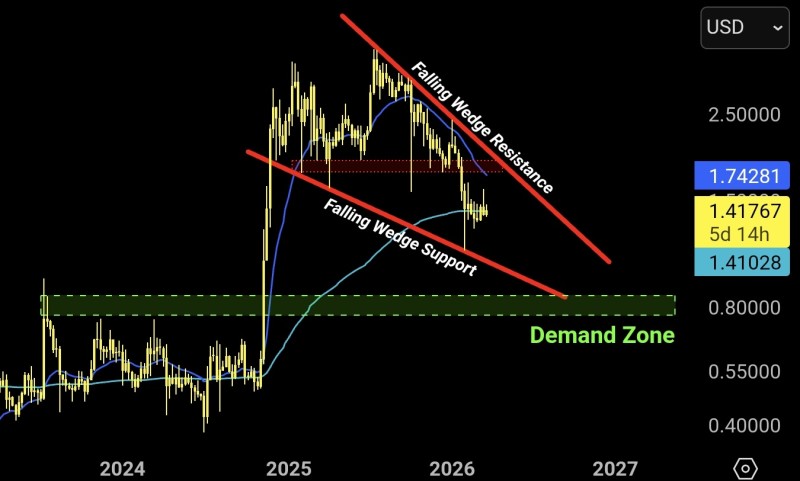
⬤The structure shows classic falling wedge characteristics: lower highs and lower lows gradually converging. A broader demand zone sits below current price, reinforcing the significance of this support area. As detailed in XRP Price Analysis: Falling Wedge Setup Signals Breakout Potential Above $2, this kind of compression typically precedes a sharp directional move.
⬤The critical trigger remains a confirmed breakout above wedge resistance in the $1.70-$1.74 zone. Until that level is reclaimed, XRP stays in consolidation mode. The importance of holding support is covered in XRP Price Analysis: $1.47 Fibonacci Support Faces Key Test, which describes support reactions as decisive for the next leg.
⬤XRP is now in a make-or-break phase. The interaction between long-term support and wedge resistance will define the next move. Once resolved, these setups tend to produce sharp expansions, a point reinforced in XRP Price Prediction: Falling Wedge Signals Possible Breakout, where breakout confirmation is required before any bullish continuation unfolds.
 Usman Salis