 Usman Salis
⬤ XRP has extended its downward move on the three-month chart, with the current candle showing continued weakness below a long-standing resistance trendline. The 3M timeframe has delivered another clear move to the downside, keeping the macro structure decisively bearish. The asset is positioned around $2.18, reflecting sustained pressure after repeated failures to reclaim upper technical levels.
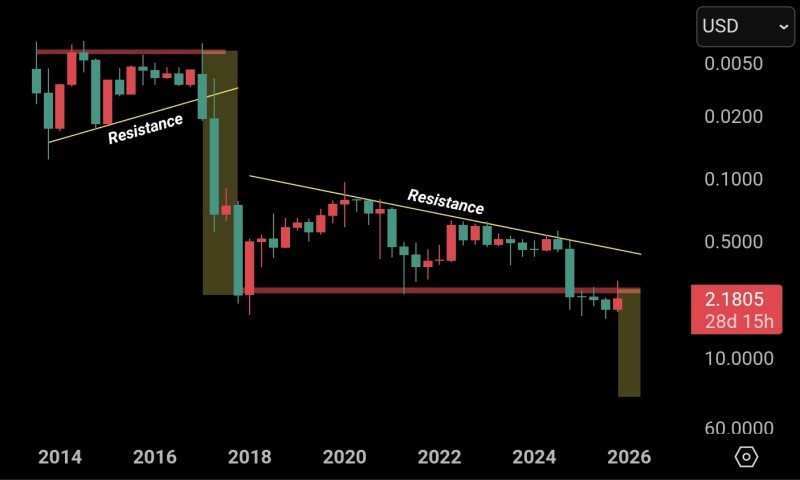
⬤ The chart shows a descending resistance line dating back several years, forming lower highs across each cycle. XRP has consistently failed to break above this trendline, leading to prolonged consolidation and successive rejections. A similar pattern occurred earlier in the decade, marked by a major drop after price compressed beneath multi-year resistance. The current setup mirrors that historical pattern, with price once again turning lower after touching the trendline.
⬤ The three-month candle also sits below a critical horizontal support band that previously acted as a macro floor. Once this level was lost, it flipped into resistance, reinforcing bearish momentum on the higher timeframe. While shorter-term charts may show localized volatility or temporary bounces, the 3M perspective reveals a broader downtrend marked by consistent lower highs and weakened structural support.
⬤ Multi-year charts carry significant weight in shaping broader market sentiment and long-term expectations. A rejection on the three-month timeframe signals deeper caution and limits the probability of a sustained reversal until major resistance levels are reclaimed. With XRP still constrained beneath both horizontal and diagonal barriers, the macro outlook remains bearish.
 Usman Salis


