 Usman Salis
⬤ XRP might be reversing course after its recent drop. The chart shows a classic double-bottom pattern—where the price hit the same low twice before bouncing back. This formation suggests "selling pressure may be slowing down" as XRP tests support in the $2.20–$2.25 range.
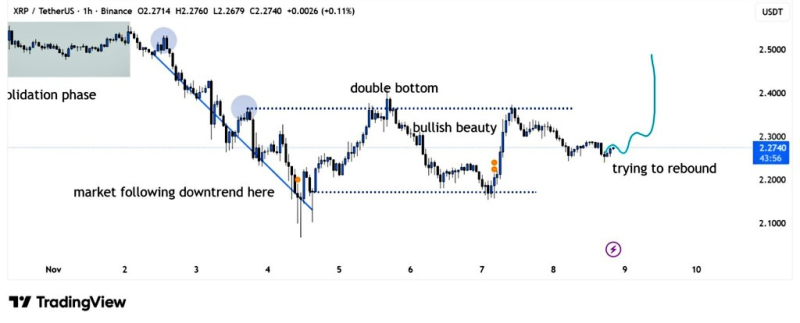
⬤ After falling through a clear downward channel, XRP has stabilized around the $2.20–$2.25 level. The chart shows buyers are now trying to push higher, with a potential bullish path mapped out if momentum continues building.
⬤ The key test ahead is the $2.32–$2.35 resistance zone. A break above this level would be the first real sign of strength after days of decline. This resistance band is clearly marked on the chart and represents the critical hurdle for bulls.
⬤ With this double-bottom pattern now in play, traders are watching to see if XRP can sustain its bounce and break through resistance. While it's still early, this setup offers the first meaningful bullish signal after the extended downtrend.
 Usman Salis


