 Usman Salis

⬤ XRP is moving toward an important technical marker on its long-term chart. The cryptocurrency is about to touch its Monthly 50 EMA for the first time since pushing above it back in November 2024. Right now, that moving average sits near the $1.33 mark.
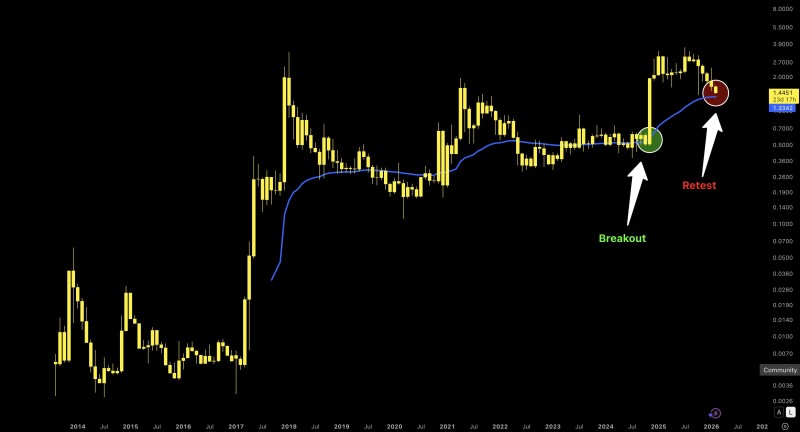
⬤ The chart pattern shows XRP initially broke through this long-term moving average and climbed away from it before turning back. Now the price is returning to test the same area that previously blocked upward movement before the breakout happened.
⬤ Traders often use the Monthly 50 EMA as a gauge for long-term trend direction. XRP hasn't interacted with this indicator since late 2024, making this upcoming test particularly significant for understanding where the asset might head next.
⬤ How XRP behaves around $1.33 will show whether it can hold above this previously broken resistance-turned-support or slip back below it. This reaction could define the market structure going forward.
 Usman Salis


