Usman Salis

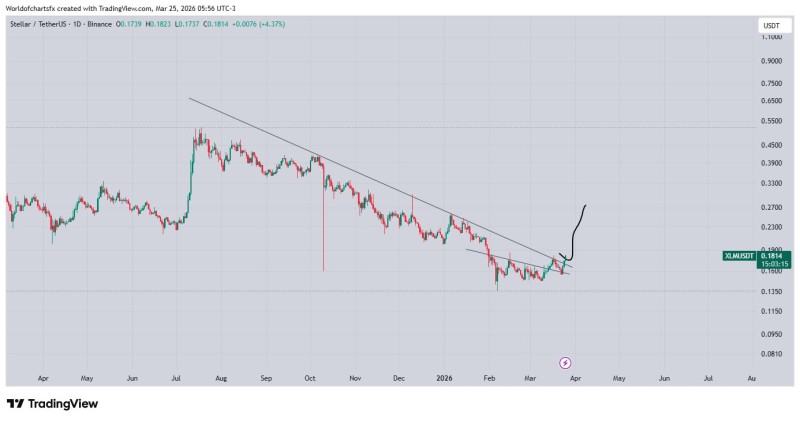
Stellar (XLM) is showing early signs of a potential momentum shift. On the XLMUSDT daily chart, price is pressing against a long-standing descending trendline near the $0.18 level -- a zone that has capped rallies since mid-2025. Whether bulls can sustain a move above it may define Stellar's next major price phase.
$0.18 Trendline: The Line That Kept XLM in Check
The downtrend in place since mid-2025 has produced a series of lower highs, with XLM repeatedly rejected at the descending resistance line. Recent price action shows the asset pushing into -- and slightly above -- that trendline. The breakout zone sits between $0.17 and $0.18. A confirmed close above this range would remove the resistance structure that has defined the bearish trend, opening the door to a broader recovery. Still, the move is unconfirmed: price remains close to the trendline without clearly establishing higher ground.
What Breakout Confirmation Could Mean for XLM
Technical structures like this one carry real precedent in Stellar's recent history. Analysts have previously outlined how a clean trendline break could fuel a Stellar (XLM) Price Eyes 50% Rally to $0.47 After Bullish Breakout, where holding above key levels was the deciding factor for follow-through. Similarly, prior analysis of Stellar Targets $0.681 With $1.29 Breakout Next showed how descending trendline breaks can initiate sustained upside when structure holds. On the downside, failure to maintain the breakout could return XLM to consolidation -- a dynamic covered in XLM Price Prediction: Approaches Critical Demand Zone, which highlighted the importance of demand zones in sustaining any momentum shift.
Trendline breaks are often the clearest signals of a transition out of a downtrend. With XLM interacting with this multi-month resistance level, the next few sessions will likely determine whether Stellar enters a recovery phase or remains within its broader downward range.
 Usman Salis