 Marina Lyubimova

Stellar (XLM) shows bullish signals after breaking key resistance, with analysts eyeing a potential rally to $0.6357.
XLM Price Breaks Critical Falling Wedge Pattern
While Stellar (XLM) traded sideways this week, something bigger was brewing. The crypto quietly broke above a falling wedge pattern that formed between July 16 and August 4 - a classic bullish reversal signal that has technical analysts taking notice.
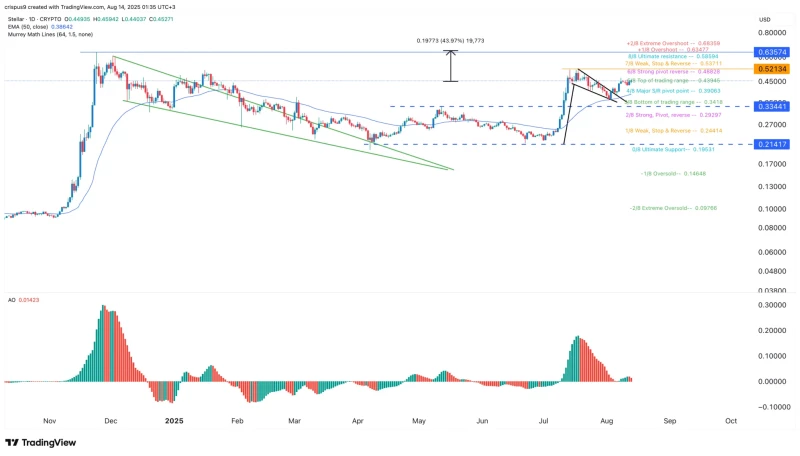
What makes this breakout special? XLM held strong above its 50-day moving average throughout the consolidation, showing buyers remain in control. The falling wedge breakout often leads to significant upward moves in crypto markets.
Technical Indicators Point to Stellar (XLM) Rally
The bullish case gets stronger when you look at other chart patterns. Stellar has formed a textbook bullish pennant - a sharp move followed by triangle consolidation that typically signals more upside ahead.
XLM has also climbed to the upper range of the Murrey Math Lines indicator, while the Awesome Oscillator sits above zero, confirming bullish momentum is building.
XLM Price Target: 43% Upside Potential
Technical analysts are targeting $0.6357 for this potential rally - Stellar's November high. That represents roughly 43% upside from current levels, making it an attractive setup for traders watching the crypto space.
This target isn't random - it's based on previous resistance that often acts as a magnet during bullish breakouts. With multiple technical patterns aligning, XLM could be setting up for its next major move higher.
 Marina Lyubimova


