 Usman Salis

Stellar (XLM) just broke out with strong momentum, but exchange flows show potential selling pressure ahead. The charts look bullish with a target near $0.97.
Stellar (XLM) Triple EMA Crossover Signals Major Move
The 4-hour chart shows a triple EMA crossover - the 20-period EMA crossed above both the 50 and 100 EMAs. This is crypto trader gold.
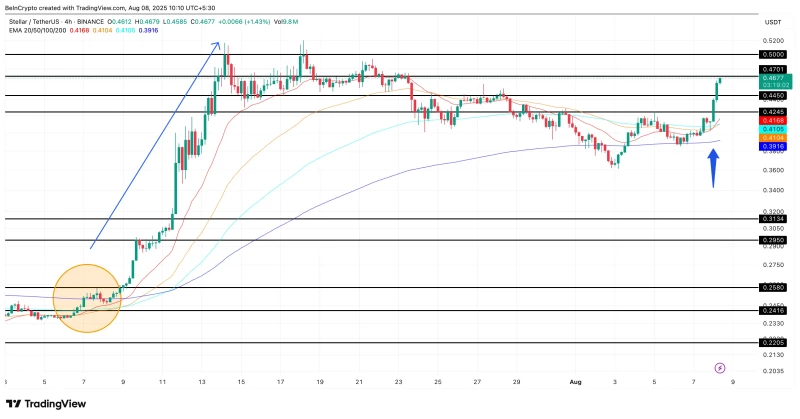
The last time this happened in July, XLM exploded from $0.23 to $0.52 - a solid 122% gain. With XLM now above $0.46, the next targets are $0.50, then the $0.52–$0.97 zone.
XLM Exchange Flows Show Profit-Taking Risk
Here's the catch: exchange netflows jumped from $724,000 to $9.12 million in one week - over 1,159% more XLM flowing onto exchanges. When coins move to exchanges, traders usually plan to sell.
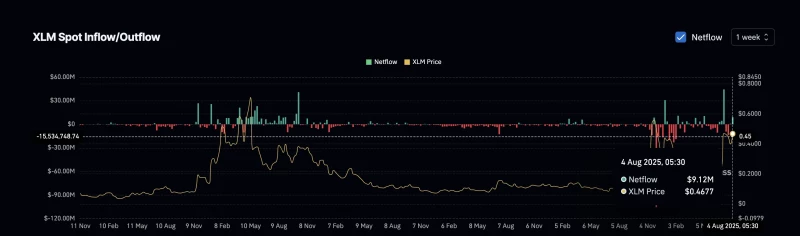
This happened before. On June 23, 2024, netflows turned positive and XLM dropped from $0.26 to $0.24. Same story on December 30, 2024. The technicals look great, but expect some profit-taking.
Stellar (XLM) Bull-Bear Power Confirms Breakout
The daily chart shows a classic pole-and-flag pattern, while the Bull-Bear Power index flipped green - buyers are taking control.
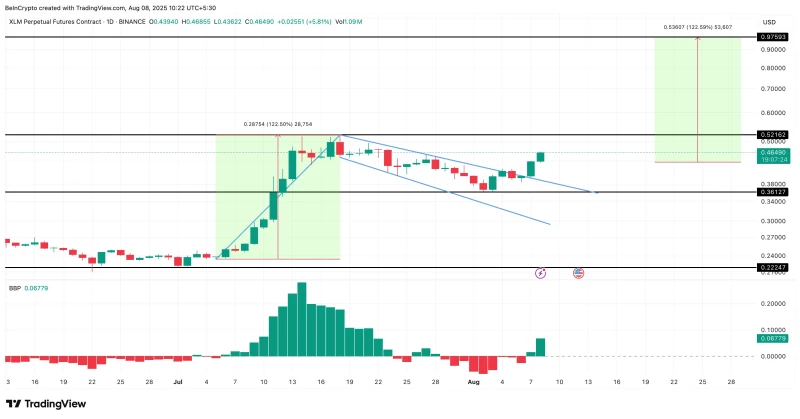
Measuring from the $0.23 low to $0.52 high projects a $0.97 target. But XLM needs to clear $0.52 first. The bullish case breaks if price drops below $0.36, especially with rising exchange flows.
 Usman Salis


