 Peter Smith

⬤ Stellar is bleeding out after losing a crucial support floor, and the 3-day chart is flashing red flags all the way down to $0.102. The token has been stuck in a brutal downtrend for months now, steadily grinding lower without much fight. After breaking below the $0.225 support that used to hold it up, XLM is now sitting in no man's land, and traders are watching to see if it'll keep sliding toward that $0.102 zone marked on the chart.
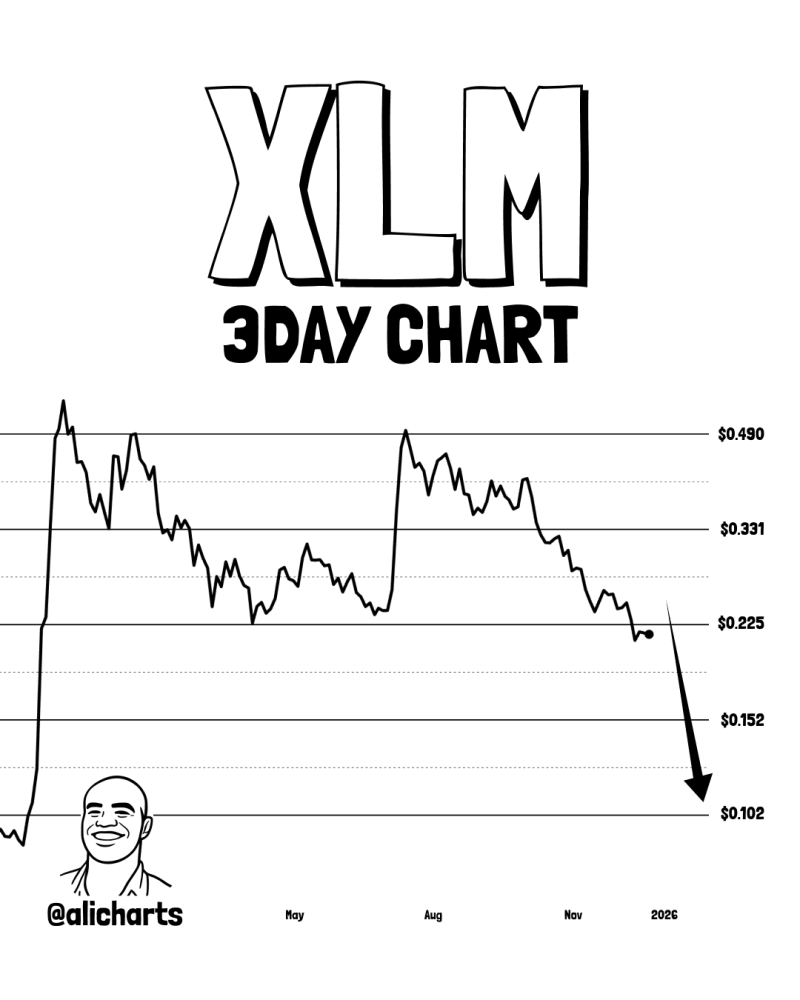
⬤ The price action tells a pretty clear story—lower highs, lower lows, classic bearish structure. XLM was trading above $0.490 earlier this year and hanging around $0.331 for a while before the bottom fell out again. Right now it's camped just under $0.225, and the chart's got arrows pointing straight down toward $0.152 and then $0.102. There's nothing on this chart screaming "recovery" yet—it's all about how much further it can drop.
⬤ That $0.102 level matters because it's the next real support where XLM might actually catch a break if sellers stay in control. The whole technical setup is defensive right now, no reversal signals, no bounce brewing. Unless XLM can claw its way back above those old support levels, the chart's basically saying "brace for more downside."
⬤ This matters because Stellar isn't some random altcoin—plenty of traders watch it, and when it's this weak, it usually means the broader altcoin market is feeling shaky too. A drop to $0.102 would confirm that sellers are still running the show and that XLM's got a long climb ahead before anyone can talk about a real recovery.
 Peter Smith


