 Usman Salis
Solana is drawing significant technical attention as key momentum indicators flash rare oversold signals. The weekly Relative Strength Index has fallen to levels last recorded during the crypto winter of late 2022, creating a setup that traders haven't seen in over two years. While the price context has changed dramatically - SOL now trades around $84 versus the $8 low of December 2022 - the technical parallels are sparking debate about whether history might repeat with a potential rebound.
Weekly RSI Signals Extreme Oversold Territory
Solana's weekly RSI has reached the same low level it hit when SOL was near $8 in December 2022. The current price has stabilized around $84, creating an interesting technical divergence between price level and momentum exhaustion. The TradingView chart shows SOL pulling back sharply from multi-year highs above $250 into the current mid-$80s range, with a visible horizontal support zone around this level.
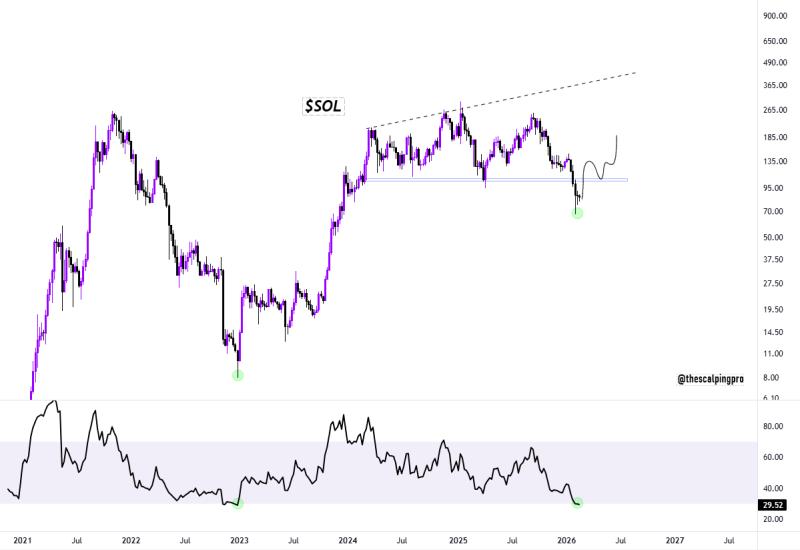
On the lower panel of the chart, the weekly RSI line sits near the bottom edge of its range, marked with a green circle emphasizing its similarity to the December 2022 oversold reading. That previous condition coincided with a cycle bottom, and the current signal suggests momentum has weakened significantly again. Price recently tested and held above the support area before printing a slight bounce, adding to the technical intrigue.
Historical Context and Market Implications
The weekly RSI can act as a barometer of selling exhaustion. When assets like Solana reach heavily oversold levels, it often coincides with periods where downside momentum is stretched, creating potential for corrective bounces or trend shifts. The 2022 low demonstrated how dramatically sentiment and price can shift after similar oversold signals, though current price remains substantially higher than that $8 trough.
Whether this oversold signal translates into a meaningful rebound depends on how price interacts with nearby support and broader market conditions. Structural price action has seen extended volatility since all-time highs, with sustained declines into 2026 drawing attention back to familiar support levels and momentum indicators. The relationship between RSI extremes and price reaction remains a critical piece of the SOL narrative as volatility persists and traders watch for signs of stabilization.
 Usman Salis


