 Alex Dudov

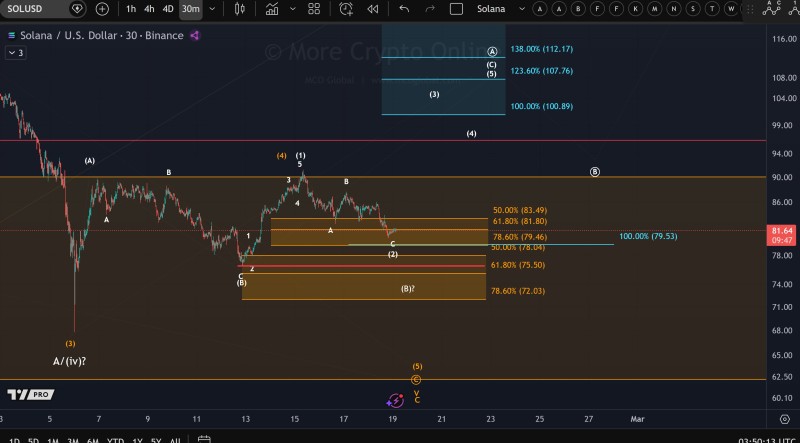
Solana price action is currently focused around a critical support zone, reported while analyzing the ongoing Elliott Wave structure. The chart highlights the $79.50 level as the next micro support, with wave (2) still extending and preventing any confirmed directional breakout.
On the provided chart, SOLUSD trades inside a corrective range following a previous upward move. Multiple Fibonacci retracement levels cluster between roughly $72 and $83, reinforcing the importance of the $79.50 region. The structure shows lower highs after the local peak, while buyers attempt to stabilize price above support.
Consolidation Phase Continues
This behavior aligns with consolidation rather than trend continuation, suggesting the market is still in a corrective phase rather than beginning a new impulse wave. The broader context shows Solana moving sideways inside a larger horizontal zone, where wave labels indicate a developing correction.
"Wave (2) still extending, preventing any confirmed directional breakout."
Price remains below nearby resistance near $90 while repeatedly testing mid-range levels. The absence of impulsive movement confirms indecision, with neither bulls nor bears fully controlling the structure. Similar setups were discussed in Solana support testing phase.
What This Means for Traders
This structure matters because support reactions often determine whether the market forms a base or continues a deeper correction. Holding the $79.50 level would maintain the current range dynamics, while a break below would indicate the corrective wave is expanding further. For now, Solana remains technically neutral, with price action driven primarily by reaction to support rather than momentum.
 Alex Dudov


