 Sergey Diakov
⬤ Solana is bouncing back from the lower edge of its long-running ascending channel that's been active for over 1,200 days since May 2022. The latest weekly chart shows SOL recovering within the lowest sub-channel zone, an area that's historically brought buyers back into the market during previous cycles.
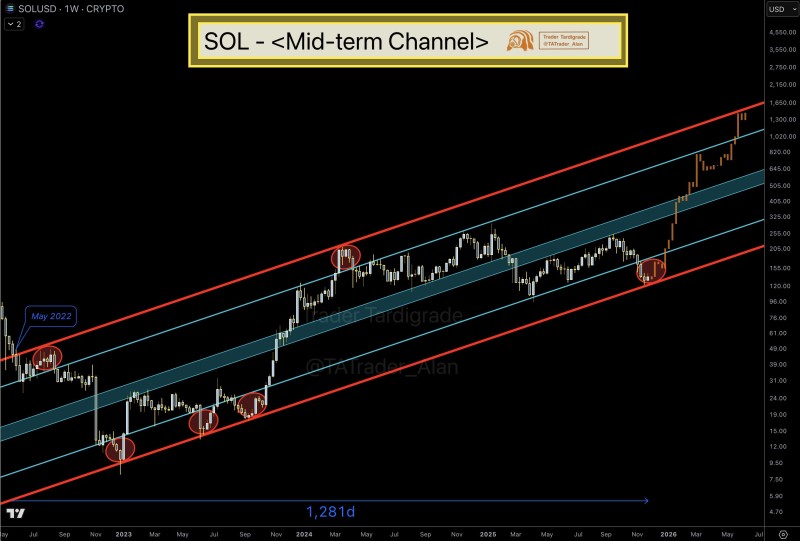
⬤ The chart reveals a well-structured multi-layered channel with several trendlines that have guided Solana's price through 2023, 2024, and 2025. During this time, SOL has consistently reacted to both upper and lower boundaries, creating a pattern of higher highs and higher lows that confirms the broader upward trend. Marked circles on the chart show multiple past bounces from the lower trendline, each leading to significant upward movements. With SOL now rising from this zone again, traders are watching to see if momentum can push it toward mid-channel and eventually higher resistance levels.
⬤ The channel's slope indicates that if current momentum continues, Solana could reach the upper sub-channel zone where resistance sits near the $1,500 mark. While there's no specific timeframe for this move, the structure shows a consistent long-term uptrend. Recent price action demonstrates SOL holding above important levels from mid-2024 and early 2025, confirming the channel's stability. Despite occasional volatility, the overall trend has remained structurally sound.
⬤ This ascending channel matters because it gives traders a clear technical framework for tracking Solana's trend strength and momentum changes. The bounce from the lower sub-channel outlines potential future paths and shows how reliable long-term structures can guide market sentiment in volatile crypto conditions. This setup continues serving as a key reference for understanding SOL's likely behavior if broader market conditions stay supportive and the multi-year trend holds.
 Sergey Diakov


