 Sergey Diakov

⬤ Solana is showing a broad consolidation pattern on the weekly chart that looks like a classic Wyckoff reaccumulation setup. The current structure shows SOL moving through several distinct phases within a well-defined range, suggesting long-term buyers are still absorbing supply rather than selling off.
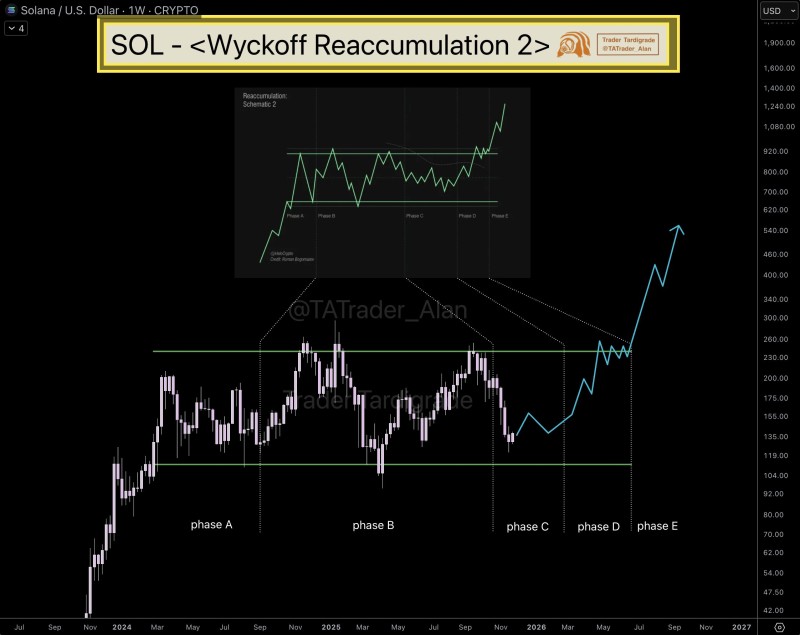
⬤ The chart maps out phases A through E, with SOL currently positioned in the later transition phases. Price has bounced multiple times off the lower boundary around $115-$120 before pushing back toward upper resistance near $220-$230. This mirrors typical reaccumulation behavior when markets are building strength, with volatility tightening as the structure becomes clearer.
⬤ The projected path shows Solana potentially forming higher lows into phase D before starting an upward move in phase E. Despite swings within the range, the weekly candles have held structural stability. Both the lower support zone and consistent reactions near resistance match the rhythm expected in a multi-month reaccumulation cycle.
⬤ Extended consolidation periods like this often come before major directional breakouts once the reaccumulation cycle completes. If Solana continues following these phases and holds support within its established range, expectations for long-term continuation could build. The structure suggests a market shifting from correction mode toward renewed momentum in the coming months.
 Sergey Diakov


