 Usman Salis
⬤ SOL just fell through a major support zone after wrapping up a massive head and shoulders pattern that's been building on the weekly chart for almost two years. The breakdown happened during the recent market sell-off, and analyst @Bitcoinsensus flagged it as a significant technical development.
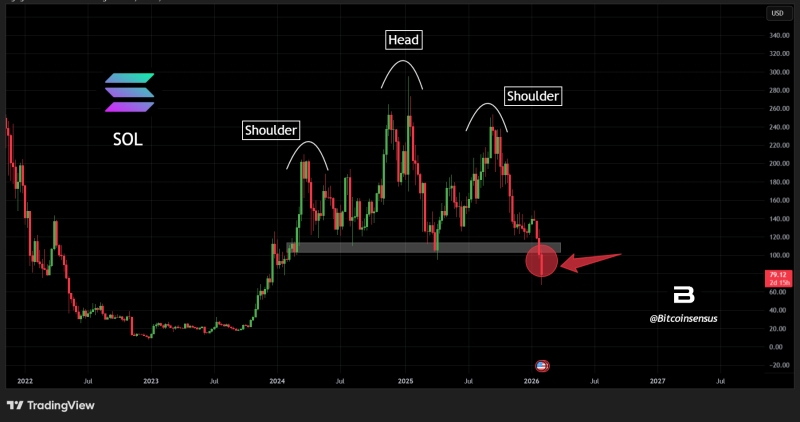
⬤ The pattern shows three distinct peaks—a higher middle top (the head) flanked by two lower highs (the shoulders). That neckline acted as solid support throughout 2024 and into 2025, getting tested multiple times before finally giving way. When Solana pushed below this level during the latest drop, it confirmed the macro breakdown traders had been watching for.
⬤ Once the neckline broke, price didn't waste time sliding toward the mid-double-digit range. That former support area now sits overhead and becomes the next key resistance zone to watch.
⬤ "The completion of this long-term pattern marks a clear shift in market structure," according to the technical outlook. If SOL stays beneath that former neckline, the door's wide open for more downside ahead.
 Usman Salis


