Alex Dudov

⬤ Solana has dropped to valuation levels rarely seen outside of major bear markets. The Z-Score indicator, which tracks how far price has deviated from its long-term average, is now in deeply negative territory. According to on-chain analyst @James, the last time SOL traded at these levels, the market was either bottoming out or preparing for a significant reversal.
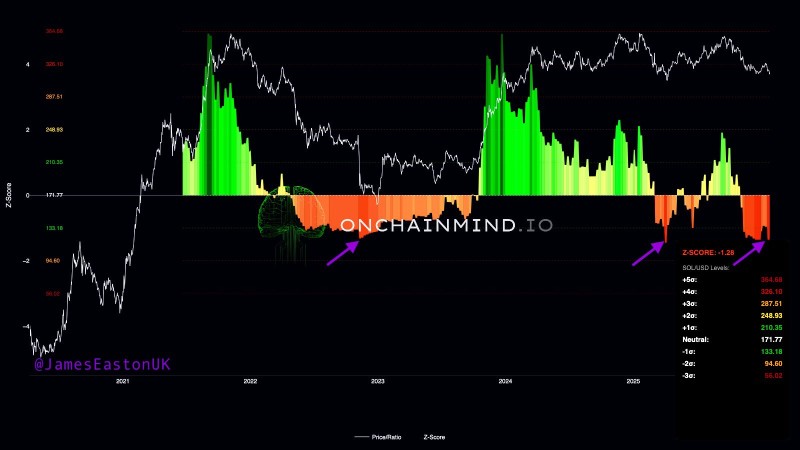
⬤ The chart shows that previous drops into negative Z-Score zones typically happened after prolonged downtrends and often marked the point where selling pressure started running out of steam. While the indicator doesn't predict exact timing, it does put current price action into historical context—and right now, SOL is trading in a zone that's been rare throughout its history.
⬤ Negative Z-Score readings appear as red and orange bars below the zero line on the chart, showing sustained undervaluation compared to historical norms. Currently, SOL sits near the lower end of what we've seen in recent cycles. At the same time, price action shows consolidation rather than accelerating drops, suggesting bearish momentum might be fading as valuations return to more normal ranges.
⬤ Z-Score readings like these matter because they identify when an asset is trading at statistically extreme levels. While low readings don't guarantee an immediate reversal, history shows these zones have consistently appeared at major turning points. For Solana, returning to these levels puts it in territory that previously aligned with significant shifts in market direction.
 Alex Dudov