Peter Smith

Solana has rebounded from a local low near $76.6 and is now trading around $84.5, approaching the $85-87 resistance zone that analyst Nehal identified as a critical supply region that must be reclaimed for any bullish continuation to hold.
SOL Downtrend Begins to Stall at $84
The chart shows a clear prior bearish structure, with SOL declining from highs near $97.6 through a series of lower highs and lower lows. That sequence remained intact until the sharp reaction from the $76 support zone.
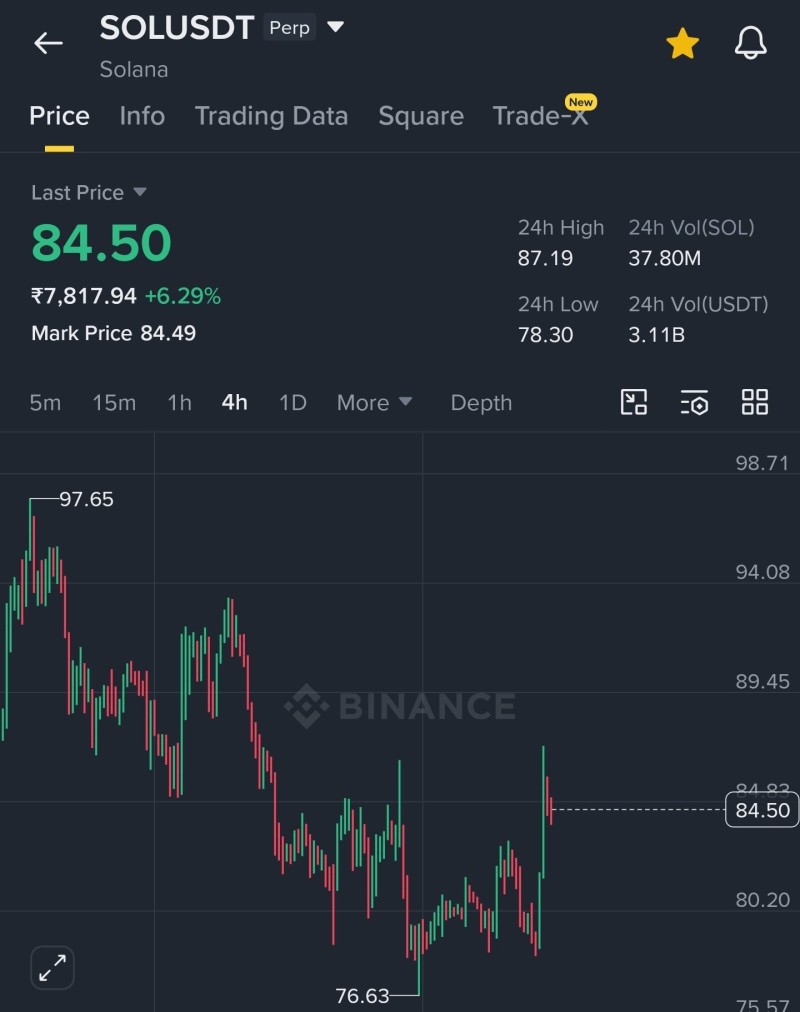
This bounce marks the first meaningful interruption of downside momentum. Price has since pushed back into the mid-range, suggesting selling pressure is weakening - but not yet fully reversed.
Recent candles reflect a shift from aggressive selling to more balanced price action, with upward expansion followed by a slight pullback just below resistance.
Recent market behavior around $80 also reflects its importance, as SOL has repeatedly reacted to this zone during declines - a pattern consistent with what Solana tests $80 support as downside pressure builds outlined in earlier analysis.
Why $87 Is the Key SOL Pivot Level
The $85-87 zone is now the defining level on the chart. It previously acted as resistance and is currently capping the latest recovery attempt. So far, price has tested this area and shown a mild rejection, indicating that sellers remain active at this level.
According to the setup:
- Holding above short-term EMAs supports bullish continuation
- A breakout above $87 opens the path toward $90, followed by $94 and $98
- Failure to break this zone keeps price within a corrective structure
SOL Structure Holding the Reversal Setup Together
On the downside, the $80-78 region serves as the first support cluster, with $76 acting as the key level that must hold. This aligns precisely with the recent swing low visible on the chart. A break below $76 would invalidate the reversal setup and confirm that the broader bearish trend remains in control.
Solana tests key resistance after rally pause outlines how similar structural setups played out in earlier range-bound phases, offering useful context for what could follow here.
Compression Between $80 and $87 Signals a Decisive SOL Move
Price is now compressing between $80 support and $87 resistance, creating a tightening range. This kind of structure typically precedes a directional breakout in either direction.
The key signals traders are watching:
- Break above $87 - continuation toward higher resistance levels
- Loss of $76 - continuation of the downtrend
Until one of these levels breaks, SOL remains in a transitional phase between bearish continuation and early reversal.
 Peter Smith