Usman Salis
Solana is struggling to find its footing after a recovery attempt that never really got off the ground. Price managed a modest rebound, but the move lacked the kind of follow-through that would signal a genuine shift in momentum. Instead, SOL remains pinned below a key resistance level, and the broader chart structure keeps pointing toward more weakness ahead.
Crypto analyst Sjuul | AltCryptoGems flagged the situation, noting that SOL attempted to push higher but failed to do so convincingly. The rebound stalled right below a clearly defined resistance zone marked on the chart, and that failure tells you everything about where sentiment currently stands.
Why the SOL Bounce Failed to Convince Anyone
The rebound looked promising for a moment, but it never produced what technicians actually need to see - a structural break above resistance. Price simply ran into the red line and stopped, without forming a higher high or any confirmation that the trend was changing.
That kind of rejection is meaningful. It suggests the market is not yet ready to absorb selling pressure at those levels, and buyers have not shown enough conviction to push through. Each failed attempt at recovery chips away at confidence and sets up the conditions for another leg lower.
Price did not form a breakout or structure shift, instead remaining capped beneath the level that would signal a change in trend.
As noted in earlier SOL price analysis covering the $119 support level, Solana has a pattern of struggling at overhead resistance during corrective phases, often requiring multiple retests before either breaking through or rolling over.
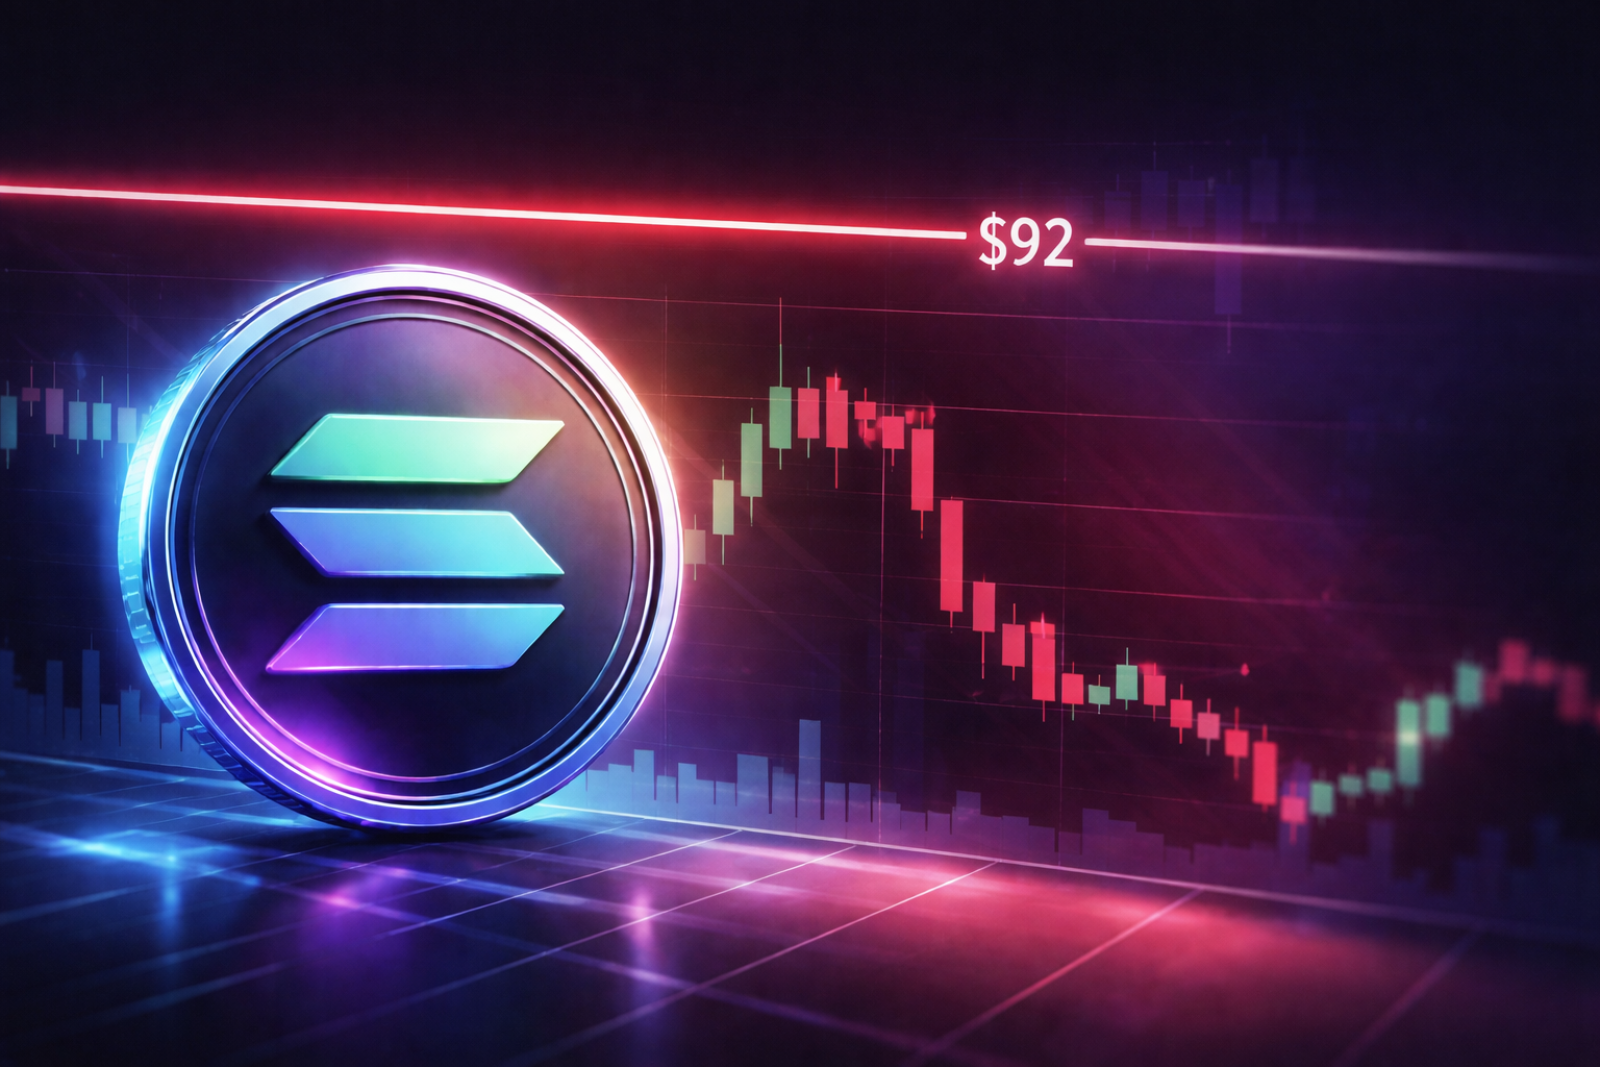
SOL Price Range: $92 Ceiling, $68 Worst-Case Downside
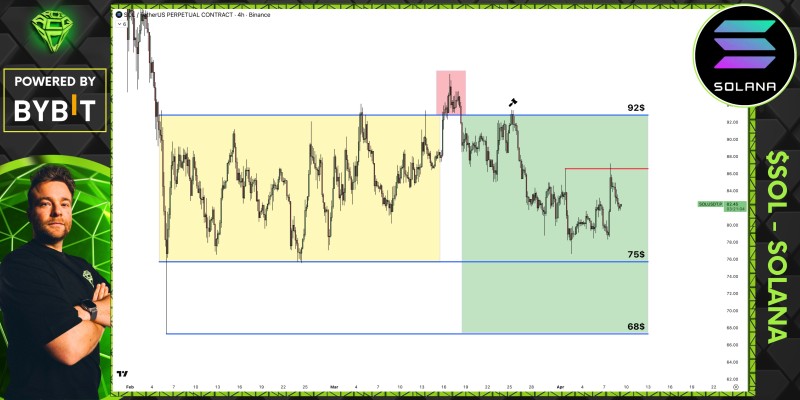
The current range tells the story pretty clearly. The upper boundary sits near $92 and has been acting as a ceiling that SOL cannot close above. On the downside, the key zones sit around $75 and $68 - levels that define how far this correction could extend if support fails.
Right now, price is trading well below that $92 ceiling, which means upside attempts remain limited by default. The structure is not bullish. It is a market sitting in the lower portion of a broader range, where recovery attempts keep stalling out before reaching anything meaningful.
The upper boundary near $92 continues to act as a ceiling, while the lower zones around $75 and $68 define the downside range.
Key observations from the current chart setup:
- Price rejected below the red resistance level
- Range spans roughly between $92 and $75, with deeper downside toward $68
- Bounce failed to produce a structure break
- Market remains below the level required for bullish continuation
This is consistent with what played out during Solana's earlier trendline test at $123, where repeated resistance rejection kept price under pressure until conditions improved enough for a cleaner move.
The Red Line Is the Only SOL Level That Matters Right Now
Until SOL breaks and holds above that red resistance level, the setup does not change. Every bounce that stops short of it just becomes another lower high in a sequence that reinforces the downtrend.
Without that break, each bounce risks becoming another lower high.
The chart also reflects a broader "power of three" structure, which in this context suggests distribution rather than accumulation. The lack of a strong reclaim keeps that interpretation intact. There is no reversal confirmation visible - only a pause within a larger distribution phase, where sellers remain in control and caution continues to dominate the price action.
The one scenario that changes everything is a clean break above the red line on strong volume. Until that happens, Solana's path back toward the $95-$100 range that analysts targeted after the $77 support hold remains blocked by overhead pressure that the market has not yet resolved.
 Usman Salis