 Marina Lyubimova
⬤ Solana is trading around $123 after several weeks of corrective price action, and all eyes are now on a descending trendline that's been capping rallies. A clean break above this line could mark the first real sign that SOL has found a local bottom. The immediate resistance zone sits between $126 and $133, where price struggled to push higher in recent attempts. Right now, SOL/USD is hovering near $122.96 on Binance.
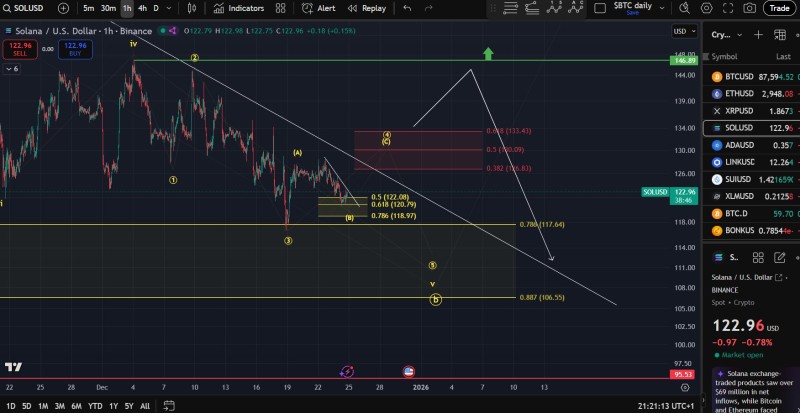
⬤ The chart shows price repeatedly testing the downward sloping resistance without much success breaking through. As one analyst noted, "the preferred scenario remains another move lower" as long as Solana stays beneath $146. Several Fibonacci retracement levels near $122.08, $120.79, and $118.97 are acting as short-term support zones where price has bounced during this consolidation period. The technical setup suggests two paths forward: either a relief rally toward the $126-$133 resistance zone, or a continuation of the broader correction.
⬤ Solana's recent volatility reflects the cautious mood across crypto markets. While breaking above the trendline resistance would shift momentum in the short term, traders remain wary below that $146 threshold. If upside attempts fail to hold, SOL could easily revisit lower support levels. The clearly marked technical zones give traders a framework for reading near-term price behavior without locking into a fixed prediction.
⬤ This matters because Solana remains one of the most actively traded altcoins, and its price movements often influence broader market sentiment. Technical patterns like trendline reactions, resistance clusters, and key price levels help shape expectations around where volatility might spike or direction might shift. The focus on $146 as a larger confirmation point shows how the market is watching Solana's price action unfold in stages as consolidation continues.
 Marina Lyubimova


