 Marina Lyubimova

⬤ Solana (SOL) reached its projected 100% extension target on the short-term chart, hitting the key technical milestone around $79.53 before pushing higher to approximately $81. This level marks an important structural point, while the invalidation threshold for the current 1-2 setup sits at $76.50 - a level that must hold for the recovery pattern to remain valid.
⬤ The chart reveals SOL climbing into the extension zone with Fibonacci retracement bands clustering nearby. The 50% retracement level at $78.04 and the 61.8% level at $81.80 create a confluence area around the extension target, suggesting multiple technical factors are converging at current prices. This range lines up with earlier analysis in SOL Trades in $76-$90 Range as Breakout Toward $100 Draws Closer where the $76-$90 corridor was identified as a key equilibrium zone.
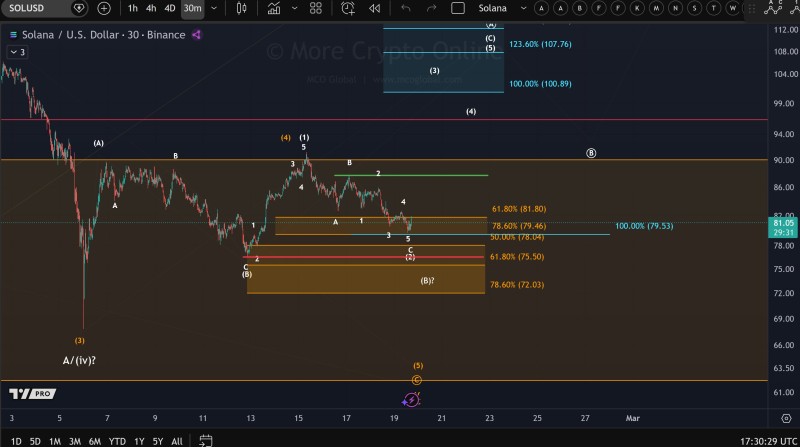
⬤ As one analyst noted, "The invalidation point for the current 1-2 setup is located at $76.50 and needs to hold before a confirmed low can be judged." This threshold sits just below recent swing lows and acts as the make-or-break level for the current wave count. If SOL drops below $76.50, the recovery setup loses validity. However, holding above this point would support the idea that a potential local bottom is forming near the full extension area.
⬤ The $76.50 level gains additional context from recent price action. Previous coverage in Solana Tests $90 Resistance Level, Potential Pullback to $77 highlighted how resistance near $90 and support around $77 have become crucial battle lines for SOL traders.
⬤ How SOL interacts with these levels over the coming sessions will shape the near-term outlook. Stability above the $76.50 invalidation point after reaching the extension target would strengthen the case for a completed retracement, while a break below could signal further downside and invalidate the current bullish structure.
 Marina Lyubimova


