Eseandre Mordi

⬤ Solana has confirmed a bearish technical breakdown after losing key support near $87. According to Crypto Patel, the head and shoulders pattern on the chart has fully played out, with price breaking below the neckline and falling roughly 4% toward the $86 zone. The setup closely mirrors prior Solana head and shoulders breakdown analysis, where similar formations led to extended downside moves.
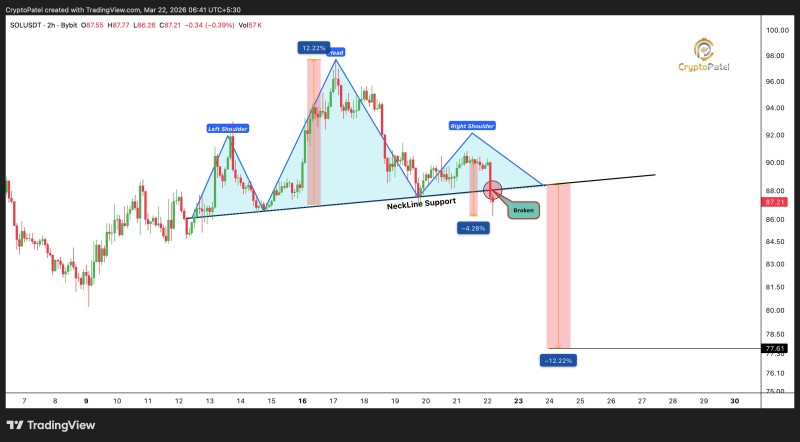
⬤ The chart shows a textbook formation: left shoulder, higher head peak, and right shoulder, followed by a break below an ascending neckline. That neckline held as dynamic support during consolidation, but once price closed beneath it, bearish momentum picked up quickly. The neckline now acts as resistance, a pattern also seen in the SOL macro pattern neckline test, where holding or losing that level defined the next move.
⬤ Using the measured move technique, the projected target sits near $70, derived from the pattern's height applied to the neckline breakdown point. The chart also flags a potential extended decline of around 12%, reinforcing bearish continuation risk if SOL fails to reclaim neckline support. Historical price action supports this, as shown in the SOL drop into the $50-$70 zone, where price previously reacted within the same target range.
⬤ This breakdown reflects weakening short-term momentum and highlights how critical neckline levels are in shaping direction. If SOL stays below neckline resistance, bearish pressure may intensify and push the asset toward lower support zones. The inability to reclaim this level keeps downside scenarios alive and adds to broader caution across the altcoin market.
 Eseandre Mordi