 Saad Ullah
Shiba Inu (SHIB) is back in the red after dropping 3.29% in the last 24 hours, and traders are wondering just how much longer this painful correction is going to last.
The crypto market's been pretty brutal lately, and SHIB definitely didn't escape the carnage. The meme coin tried to bounce back recently, but that little recovery didn't have any staying power. Now everyone's scratching their heads, trying to figure out when this downtrend might finally run out of steam.
SHIB (Shiba Inu) Charts Tell Different Stories Depending on Where You Look
Here's the thing about SHIB right now – it really depends on which timeframe you're checking out. On the hourly chart, the price is basically stuck in the middle of a local channel, not really doing much of anything exciting. But if the buyers actually decide to show up and push things higher, we could see a breakout that sends SHIB toward that $0.00001150 level.
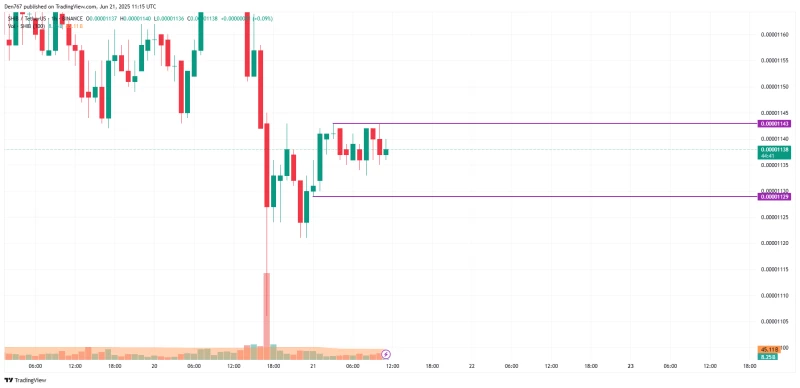
That $0.00001150 zone is pretty important because it's been a key level before – sometimes acting as support, sometimes as resistance. So if SHIB can actually get there, it'll be interesting to see if it can break through or just bounce off again like it has in the past.
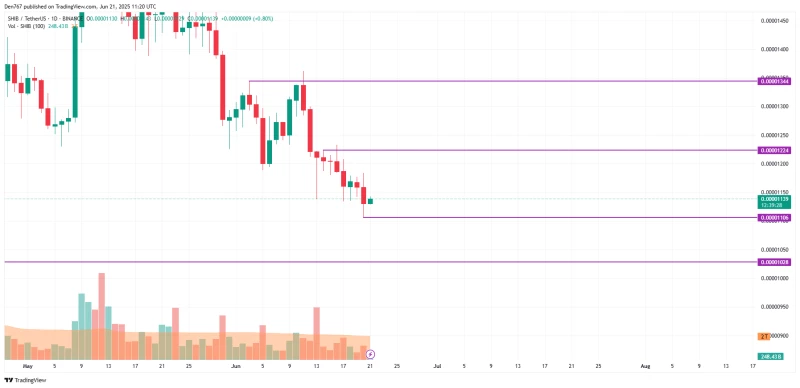
The daily chart tells a different story though. SHIB's basically been trading within yesterday's range, which means neither the bulls nor the bears have enough juice to make anything dramatic happen. It's like everyone's just waiting around to see who's going to make the first move.
SHIB (Shiba Inu) Likely to Keep Bouncing Around in the Same Range
Given how things look right now, most analysts think SHIB is probably going to keep trading sideways for a while. We're talking about a range between $0.00001120 and $0.00001180, which isn't exactly the most exciting thing in the world if you're looking for big moves.
This kind of choppy, range-bound action can actually stick around longer than people expect. It usually takes some kind of catalyst – whether that's good news, bad news, or just one side finally getting enough firepower – to break out of these patterns.
Right now, SHIB is sitting at $0.00001138, which puts it pretty much right in the middle of that expected range. So unless something changes pretty dramatically, we're probably looking at more of the same sideways grinding for the near future.
SHIB's Weekly Picture Doesn't Look So Hot
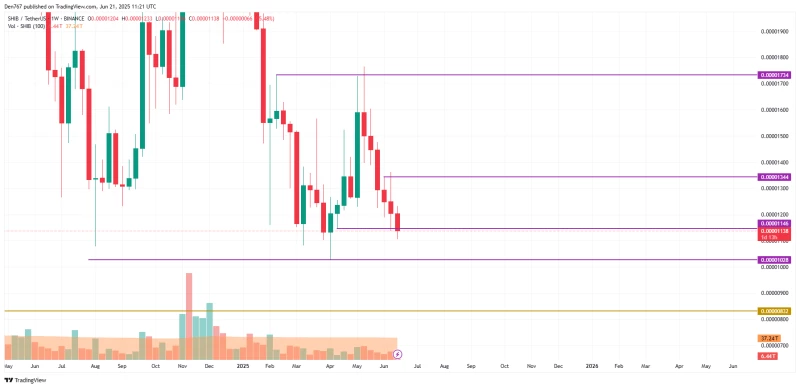
While the short-term charts are kind of mixed, the weekly view is where things get a bit concerning for SHIB holders. From a bigger picture perspective, the trend is definitely looking bearish, and that's not great news if you're hoping for a quick turnaround.
The key level everyone's watching is that weekly support at $0.00001146. If SHIB can't hold above this level and we see a weekly close below it, things could get ugly pretty fast. The next major support area is down around $0.00001050 to $0.000011, which would mean another 7-10% drop from where we are now.
Nobody wants to see that happen, but it's definitely a possibility given how weak the weekly chart looks. This kind of scenario would fit right in with what we've been seeing across the broader crypto market – lots of coins struggling to maintain their recent gains and giving back chunks of their rallies.
The correction SHIB is going through right now is pretty typical for meme coins. They tend to rocket up fast when sentiment is good, but they can also come down just as quickly when the music stops. For anyone still holding SHIB or thinking about jumping in, it's definitely worth keeping an eye on these key levels and maybe not betting the farm until we see some clearer signs of where this thing is headed next.
 Saad Ullah


