Saad Ullah

Shiba Inu is showing signs of stabilization after a prolonged decline, with price compressing tightly near a well-defined support zone. According to TheCryptoBasic, the current structure reflects a classic accumulation phase, where momentum is building quietly beneath resistance.
A Base Forms After the SHIB Downtrend
The chart highlights a clear transition from bearish pressure into sideways consolidation.
After a sequence of lower highs, SHIB found support in the $0.00000564-$0.00000550 range, where price has consistently held.
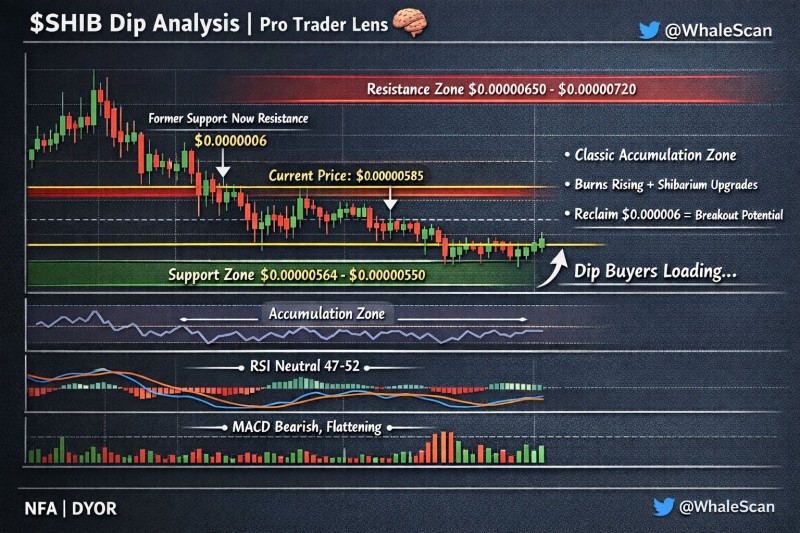
This support zone is now acting as a foundation, preventing further downside and signaling that selling pressure has eased. At the same time, the $0.0000060 level - previously support - has flipped into resistance, capping recovery attempts and defining the upper boundary of the range. Traders watching for a Shiba Inu price consolidation before potential upside have been eyeing exactly this structure.
Tight Structure Reflects SHIB Market Balance
Recent candlestick behavior shows reduced volatility, with price moving in a narrow band just above support. This tightening structure reflects equilibrium between buyers and sellers - a common characteristic of accumulation zones.
RSI remains neutral around the 50 level, while MACD is bearish but flattening - both pointing to fading downside momentum rather than active selling pressure.
Momentum indicators align with this view. RSI remains neutral around the 50 level, while MACD is bearish but flattening - both pointing to fading downside momentum rather than active selling pressure. Volume has also declined, reinforcing the idea that the market is in a low-activity consolidation phase.
This type of compression is often associated with accumulation patterns, where positions are gradually built before expansion phases begin - as seen in similar SHIB setups where 87% consolidation precedes stronger moves.
The $0.0000060 Break Level That Changes SHIB Structure
The technical setup now centers around the $0.0000060 resistance level. A decisive move above this threshold, especially with increased volume, would signal a shift in control back to buyers.
The current structure can be summarized through its defining elements:
- Strong support holding at $0.00000564-$0.00000550
- Resistance established at $0.0000060 after role reversal
- RSI neutral near 50, indicating balanced momentum
- MACD flattening as bearish pressure fades
Accumulation phases like this often precede volatility expansion, with price eventually breaking out of the range once sufficient pressure builds.
This configuration reflects a market preparing for a directional move. Accumulation phases like this often precede volatility expansion, with price eventually breaking out of the range once sufficient pressure builds. Analysts tracking SHIB buyers preparing for a potential mega rally point to this exact dynamic as the setup to watch.
For now, SHIB remains locked between support and resistance - but the tightening structure suggests that the next move may be closer than it appears.
 Saad Ullah