Eseandre Mordi

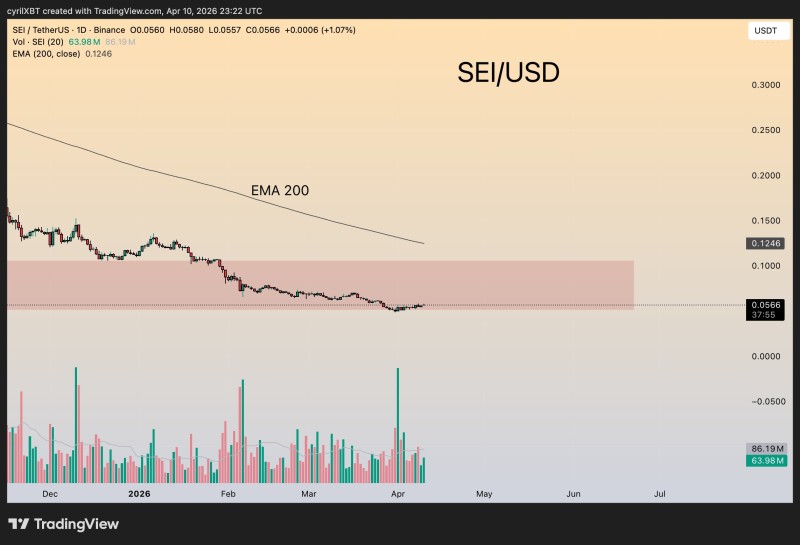
SEI is holding near $0.056, but the broader technical picture remains firmly bearish. Price is still far below the 200-day moving average, which sits around $0.12 - a gap wide enough to underline just how deep the current downtrend runs and how little has changed in terms of structural recovery. Crypto analyst CyrilXBT pointed out that there has been no structure break yet, putting SEI in a watch-only mode rather than any kind of confirmed recovery phase.
The gap between spot price and this long-term indicator reflects the depth of the ongoing slide and the absence of any real reversal signal so far.
The SEI Downtrend That Has Not Broken
Price action on the daily chart shows a persistent run of lower highs and lower lows. That sequence has been intact for months and nothing in recent sessions looks like it is changing.
There has been a degree of stabilization, but stabilization is not the same as a structural shift - buyers are not back in control.
No structure break yet - SEI remains in a watch-only state rather than a confirmed recovery phase.
The 200-day moving average, currently near $0.124, continues to slope downward and functions as a distant dynamic resistance zone. Price is sitting at a steep discount to long-term trend positioning, which reinforces the bearish tilt across timeframes. Prior SEI coverage around the $0.065 demand zone noted the same dynamic: the asset had already fallen 94% from its 2024 peak with no structural reversal in sight.
SEI Builds a Weak Base Without Volume Confirmation
SEI is currently consolidating inside a narrow range near $0.055-$0.060. That is not the same as accumulation. The chart shows limited upside follow-through and continued compression near local lows - the kind of price action that reflects uncertainty more than conviction.
Demand is still reactive rather than aggressive - volume spikes are not producing any meaningful upside follow-through.
Volume activity remains inconsistent. Occasional spikes appear, but they fail to push price meaningfully higher. That pattern suggests demand is still reactive rather than aggressive - traders responding to dips rather than actively building positions. Earlier technical analysis flagging RSI divergence as a potential rebound signal has so far not translated into any sustained move.
Why $0.08 Is the Critical Level for SEI Recovery
The $0.08 level stands out as the first real threshold worth watching. It marks a zone of prior support that has since flipped into resistance within the broader downtrend - exactly the kind of level that would need to be reclaimed before the chart story starts to change.
A reclaim of $0.08 combined with a noticeable increase in volume would be the minimum requirement to signal any shift in momentum.
A close above that zone, paired with a noticeable pickup in volume, would be the minimum requirement to suggest any momentum shift is underway. Until that happens, the market structure continues to favor the downside. Recent technical coverage remains aligned with that view - earlier analysis targeting a potential 400% SEI rally from critical support still hinges on key level reclaims that have not materialized.
SEI remains under pressure - trading far below its 200-day moving average, sitting roughly 55% beneath long-term trend levels, and failing to break its pattern of lower highs. The chart shows a market that is stabilizing, not reversing. Until price reclaims $0.08 with real conviction behind it, the bearish structure stays intact.
 Eseandre Mordi