Alex Dudov
SEI is trading at a critical juncture. According to CyrilXBT, the token continues to grind along the bottom of its demand zone, with no reversal structure in place. The chart reflects this clearly - price has flattened after a prolonged decline without establishing any meaningful upward momentum.
Where SEI's Downtrend Pauses at Support
The dominant structure remains bearish, with price positioned near the lower boundary of its recent range. The most notable change, however, is the absence of new lows.
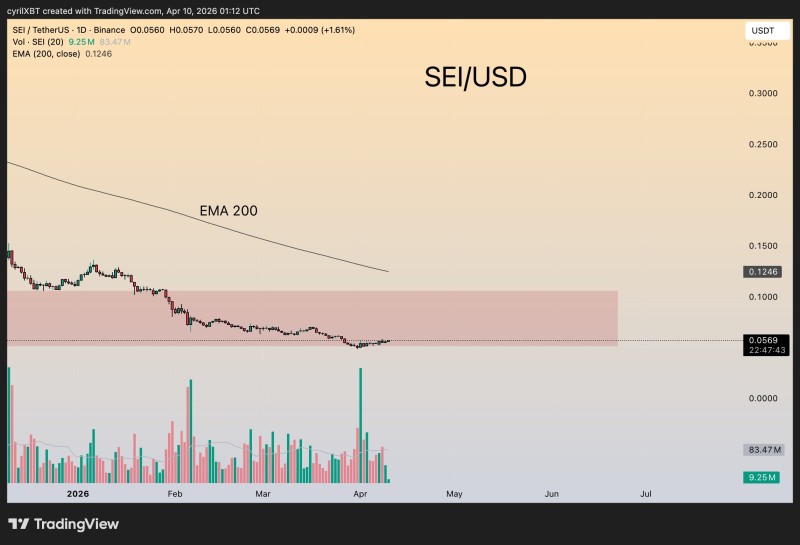
Instead of continuing downward, SEI has begun moving sideways within the demand zone. This shift suggests that selling pressure is no longer accelerating, even though buyers have not yet taken control.
Assets tend to stabilize around support after extended declines, often signaling a pause rather than a confirmed reversal.
This behavior aligns with broader patterns seen across the crypto market - a quiet stretch near lows that looks unremarkable until it isn't.
The 200 EMA Gap That Defines SEI's Weakness
One of the clearest signals on the chart is the gap between price and the 200 EMA, which sits significantly higher at $0.1246. This distance reinforces the lack of bullish structure. SEI Tests $0.065 Demand Zone After 94% Drop From 2024 High explores similar accumulation behavior near this same support, where the distance from long-term trend indicators played a central role.
Price remains well below its long-term trend indicator, meaning any recovery would require a substantial shift in momentum before changing the broader picture. The EMA is not currently interacting with price, which keeps the focus on the lower range rather than any reversal attempt.
The gap between price and the 200 EMA isn't just a number - it's a measure of how much work bulls still have to do before this market can be called healthy again.
The SEI Signal That Has Not Appeared Yet
The defining feature of the current setup is stagnation without confirmation. Price is no longer trending lower, but it has also not formed higher highs or broken any resistance level that would matter.
Two scenarios remain in play: early base formation or continuation within a broader downtrend. The deciding factor is volume - and right now, volume isn't saying much. SEI Price Analysis: Bullish RSI Divergence Signals Potential Rebound from $0.069 highlights weakening downside momentum through RSI divergence, which adds a layer of nuance to the current stall.
Consolidation near support can precede a larger directional move once selling pressure exhausts itself - but that exhaustion needs to show up in the data before it means anything.
Until volume steps in to validate the pause, this is a market that has stopped falling, not one that has started recovering.
The two outcomes worth watching:
- Base formation - price continues to coil inside the demand zone, volume gradually builds, and a breakout structure begins to develop
- Trend continuation - the pause fails, sellers return, and SEI breaks below the current zone into lower support
SEI Eyes 400% Rally as Price Tests Critical $0.15-$0.13 Support Zone outlines the longer-term compression setup that makes the current zone meaningful in the broader structural context. For a parallel look at how similar dynamics play out across crypto, XRP Retest After Multi-Year Triangle Breakout Signals Critical Moment provides useful comparative context on post-breakout behavior and retests near key levels.
 Alex Dudov