 Marina Lyubimova

⬤ Hyperliquid now rests on a level that will decide its next major move after it fell back from its recent peaks. HYPE trades at the 0.618 Fibonacci retracement and also sits on a horizontal support band that served as strong resistance right after the token debuted. On the weekly chart the price has steadied near $28 - $29, where buyers appear after months of steady selling.
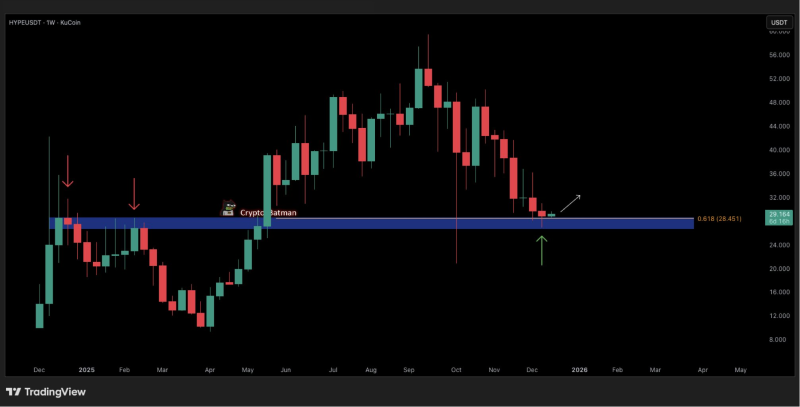
⬤ That same band shaped earlier price action - it rejected rallies multiple times before price finally broke above it and sprinted toward the mid-$50s. After the top HYPE slid plus returned to the old barrier. Because the historical level matches the 0.618 Fibonacci retracement, the area carries extra weight - price is holding at support rather than slicing through.
⬤ Weekly candles now show weaker selling than at the start of the drop. Their bodies are smaller and they fail to press lower, a sign that sellers are tiring near support. No reversal is confirmed - yet staying above this mark preserves the larger structure and averts a deeper fall. The market is testing whether buyers will protect this key zone.
⬤ For the wider crypto market, Hyperliquid's action here carries weight because traders have watched the token since its strong debut. Reactions at major Fibonacci levels often steer short term mood but also volatility. If the support holds, price may stabilize or move sideways. If the level gives way, focus will shift to lower supports. At the moment HYPE stands at a critical technical junction.
 Marina Lyubimova


