 Artem Voloskovets

⬤ Hyperliquid's price has found support after bouncing from a key Fibonacci zone on the two-day chart. HYPE showed a clean reaction from the golden pocket area—a level traders watch closely during corrections. The chart shows price holding between the 0.618 and 0.70 retracement levels, suggesting buyers stepped in after the pullback from recent highs.
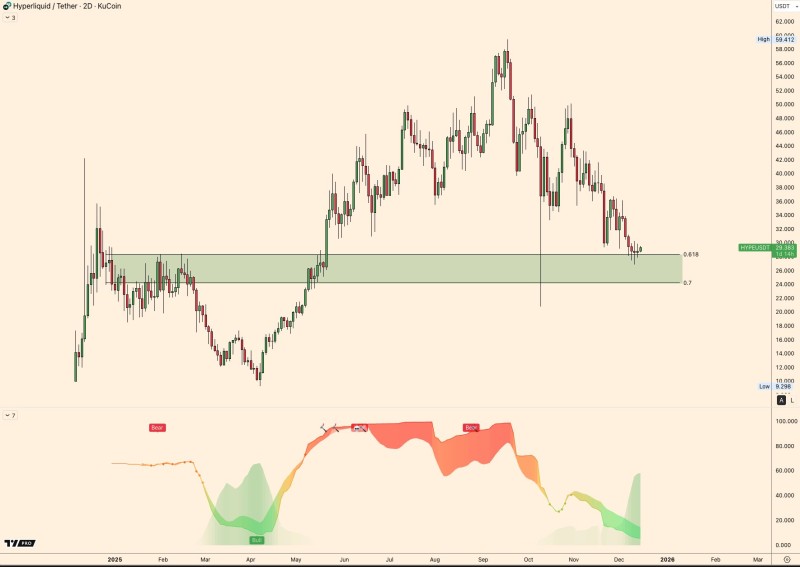
⬤ HYPE previously peaked near the upper $50 range before sliding into a sustained decline. The move brought price down to the mid-to-high $20s, where the highlighted support band sits. This zone lines up with the golden pocket from the earlier rally, making it technically significant. Recent candles show price consolidating here rather than breaking lower with force.
⬤ The momentum indicator below the chart also points to improving conditions. After staying bearish for an extended period, it's started turning higher, showing that selling pressure is fading as price holds support. While this doesn't confirm a reversal yet, it suggests the downtrend may be losing steam. The combination of respected Fibonacci support and stabilizing momentum hints at a potential base forming.
⬤ This matters because golden pocket reactions often shape short-term sentiment and volatility, especially in assets that have seen sharp moves followed by deep pullbacks. HYPE holding this support zone could define what comes next—whether that's continued consolidation or a new directional move. The current setup shows how Fibonacci levels and momentum indicators remain central to how traders are reading the market right now.
 Artem Voloskovets


