Eseandre Mordi

⬤ Ethereum's price is tightening into a classic bearish pennant on the 3-day chart. ETH is caught between converging trendlines following a significant downturn, creating a pattern that typically signals more downside ahead.
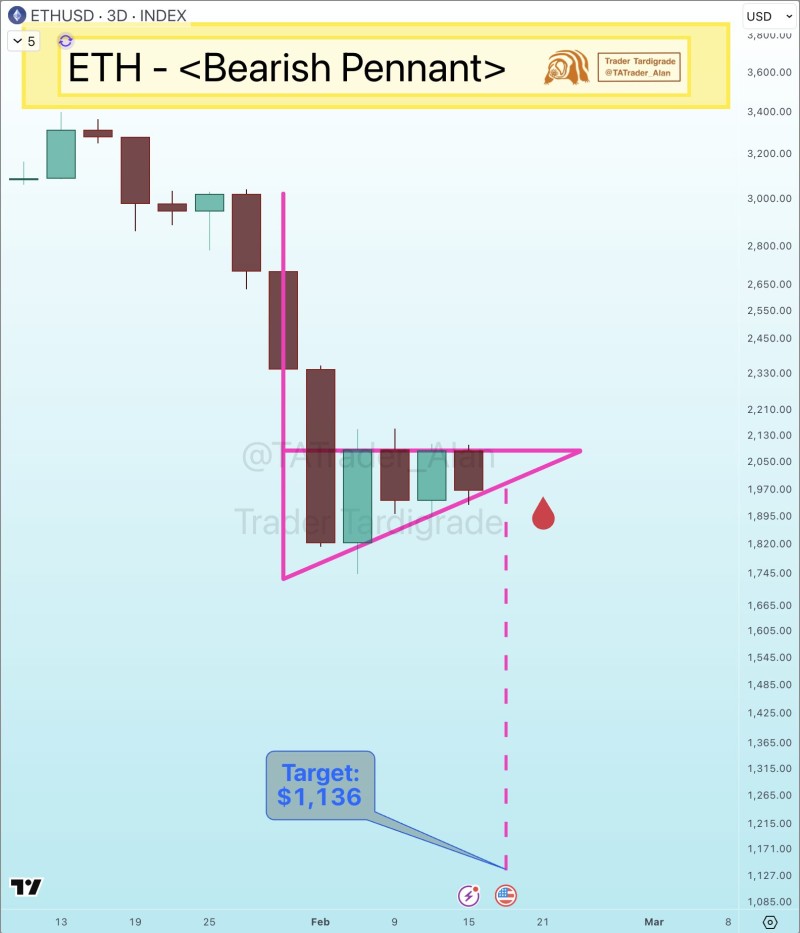
⬤ Instead of bouncing back, Ethereum continues moving sideways below previous support levels. This shrinking price range shows the market is taking a breather after the selloff, though the underlying structure remains bearish. We've seen similar dynamics when Ethereum tested resistance while facing downside risk in recent months.
⬤ The key now is watching that lower trendline. If Ethereum breaks below it, the pattern's measured move projects a drop toward $1,136. That's not a random number—it's calculated based on the pennant's structure and the size of the initial decline. Similar pressure emerged when Ethereum struggled below the $4,200 resistance with sellers in control.
⬤ This isn't the first time we've witnessed this kind of setup. Previous bearish targets formed after key structure failures, and once support gave way, the downside momentum accelerated quickly. The current pennant shows the same characteristics—reduced volatility, sideways consolidation, and a bearish bias underneath.
⬤ For now, Ethereum holders should watch that lower boundary closely. A clean break below could trigger the next wave of selling, potentially taking ETH down to four-digit levels for the first time in months.
 Eseandre Mordi