 Saad Ullah

⬤ Ethereum entered a decisive phase after a sharp sell-off pushed it straight into the $2,000–$2,200 support zone shown on the daily chart. The drop came after ETH failed to hold above $3,050 and $2,700, then accelerated downward. Strong selling momentum sliced through earlier consolidation zones, landing price at a level that's historically attracted major buying interest.
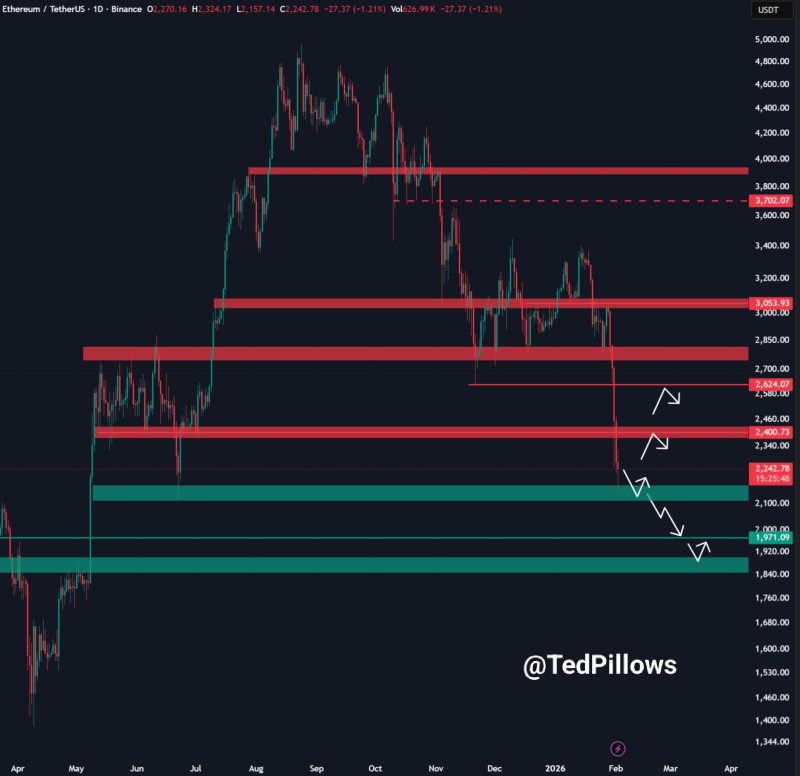
⬤ The $2,000–$2,200 area stands out as a must-hold region based on past market structure. This wide support band previously served as a base during earlier accumulation phases. ETH reached this point after getting rejected multiple times near $3,700 resistance and grinding through a prolonged series of lower highs and lower lows. The speed of the decline shows just how intense the selling pressure became as price approached this zone.
⬤ From a structural standpoint, Ethereum shifted from range-bound trading into a clear breakdown. Losing the $3,050 midpoint and $2,400 support knocked out key technical defenses that had contained price through most of 2025. If the current support fails, ETH could face additional downside toward the April 2025 lows, which line up with the lower demand zone visible on the chart.
⬤ This moment matters for Ethereum's technical outlook because it's testing long-term support after an extended drop. A solid hold within $2,000–$2,200 would signal stabilization following a sharp reset, while a confirmed break below opens the door to deeper corrective moves. How price behaves here will determine whether ETH consolidates or extends its downtrend.
 Saad Ullah


