 Marina Lyubimova

⬤ Ethereum is back at a pivotal zone after sliding toward $1,800 again, with each retest raising the odds that support might crack. The 12-hour ETH/USDT chart shows price hovering in the mid-$1,800s, just above the marked support line at $1,798.
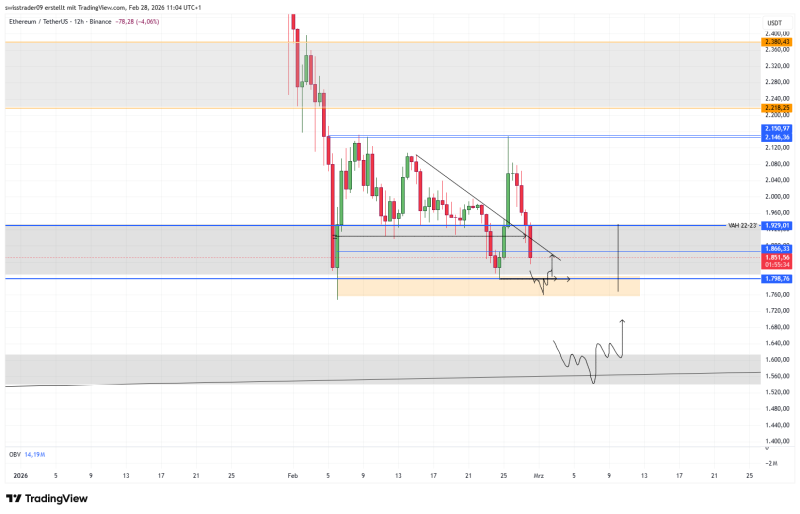
⬤ The setup shows a series of lower highs and a descending trendline squeezing into the same support shelf, creating a tightening structure. Overhead, several reference levels appear - a blue line near $1,929, a band in the high-$1,800s, and resistance zones in the low $2,100s. Price tried to bounce earlier but got rejected, returning to the same floor. This matches the warning that Ethereum Faces $2,100 Supertrend and Channel Resistance, making each test potentially weaker if buyers can't reclaim nearby resistance.
⬤ The chart also backs up the "thin air" observation - below $1,800, the next clear zone doesn't appear until around $1,600, suggesting fewer technical cushions if $1,798 breaks cleanly. That doesn't mean a straight drop, but it explains why the $1,750-$1,600 corridor could see fast moves during volatile periods. The right-side annotation reinforces the "rollercoaster" scenario mentioned in the commentary, while ETH Tests $1,800 Support Zone as Chart Points to Potential Rally explored earlier bounce attempts from this same level.
⬤ This matters because repeated hits on major support can determine whether ETH consolidates or enters a deeper correction. Related analysis at Ethereum Eyes Critical $1,800-$2,200 Support Zone That Could Shape Next Move has also tracked this range as Ethereum's key decision area heading into the next phase.
 Marina Lyubimova


