 Saad Ullah

Ethereum continues to trade within a corrective structure, with price stabilizing around $1,980 on the short-term chart. The technical setup outlines a possible five-wave downside scenario if the market fails to reclaim key resistance. The level to watch is $2,057 — a breakout there could confirm that a short-term low is in and that a recovery is underway. As noted in Ethereum Tests the $1,950-$2,000 Support Zone: 3 Key Levels to Watch Now, reaction around the $2,000 area has been viewed as a potential pivot for the next short-term trend.
Fibonacci Levels Frame the $1,967-$2,057 Decision Zone
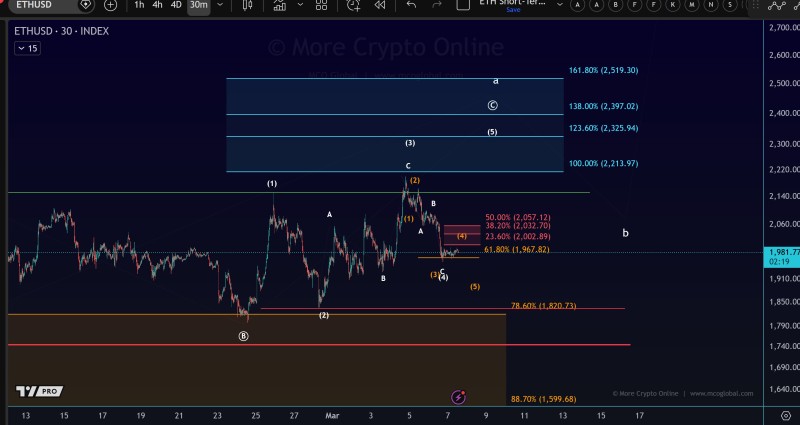
Several Fibonacci retracement levels define the current structure. Resistance sits at $2,002 (23.6%), $2,032 (38.2%), and $2,057 (50%), while price recently bounced from support near the 61.8% level around $1,967. Ethereum has been compressing between these zones — the kind of consolidation that often precedes a directional expansion. A very similar setup was analyzed inEthereum Faces Wedge Resistance at $1,985 While Testing 20-Day Average, where ETH traded inside a narrowing pattern before a breakout attempt.
Downside Risk Extends to $1,820 and $1,600 if Bears Hold Resistance
If resistance holds, the projected five-wave decline could push ETH toward deeper support near$1,820(78.6% retracement) and potentially$1,600(88.7% retracement). These are the levels where buyers would likely need to step in to prevent a deeper drawdown. On the flip side, a clean break above $2,057 shifts the structure toward recovery, with upside extension targets visible around$2,214and$2,397. As explored inEthereum Price Analysis: Wave Structure Points Higher, constructive Elliott Wave setups can support meaningful upside once key resistance levels are cleared. For now, the market remains in a wait-and-see mode — compressed, coiled, and watching $2,057 as the line in the sand.
 Saad Ullah


