 Eseandre Mordi

⬤ Ethereum's daily chart against Tether tells a story of recovery that's more grind than glory. After bouncing hard from that $2,600–$2,800 demand zone, ETH has worked its way back to around $3,300 and seems to be settling in. The chart shows this isn't some rocket launch—it's more like a patient rebuild where the price structure is actually improving rather than just pumping and dumping.
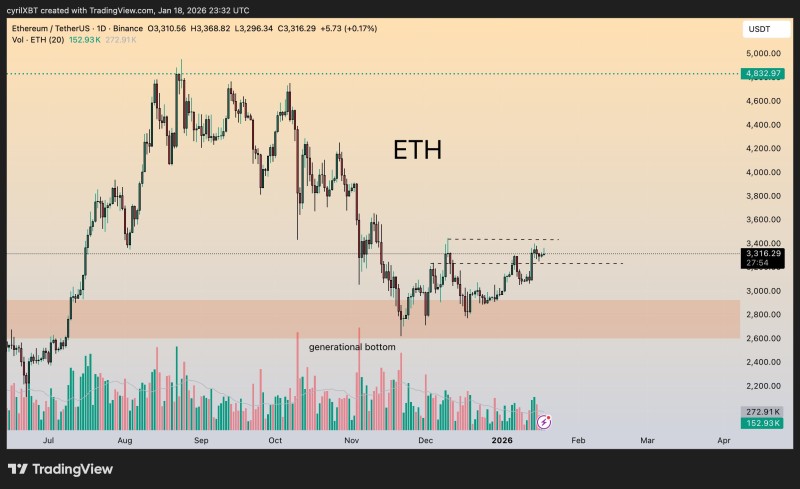
⬤ The bigger picture shows ETH topped out near $4,800 before things got ugly. What followed was a classic bear move—lower highs, choppy volatility, and eventually a flush down into that accumulation zone where smart money tends to show up. Volume spiked during the selloff, but once price hit that $2,600s area, the bleeding stopped. Since December, ETH's been quietly stacking higher lows, which is exactly what you want to see when a market's trying to turn around.
⬤ Right now, Ethereum's trading inside a defined range with clear resistance above and support below. It's not breaking out yet, but it's also not breaking down—and that matters. The fact that ETH keeps holding above recent lows shows sellers are backing off while buyers are starting to step in at these levels. This kind of price behavior usually means the market's shifting from panic mode to wait-and-see mode.
⬤ For the wider crypto market, this matters because Ethereum moves differently than Bitcoin—it's basically the backbone of DeFi and smart contracts. When ETH starts building a base like this with higher lows and steady consolidation, it tends to pull money back into the ecosystem. If this recovery holds and ETH keeps defending this reclaimed zone, it could signal that the worst is behind us and set the tone for how altcoins and DeFi projects behave in the coming weeks.
 Eseandre Mordi


