Peter Smith

⬤ Ethereum heads for a decisive technical test. A large inverse head-and-shoulders formation is now visible on the weekly chart. The latest advance has shaped the right shoulder, a step that reinforces the bullish layout traders have followed since mid-2024. Price has reached $3,300 and the structure implies further gains once it completes.
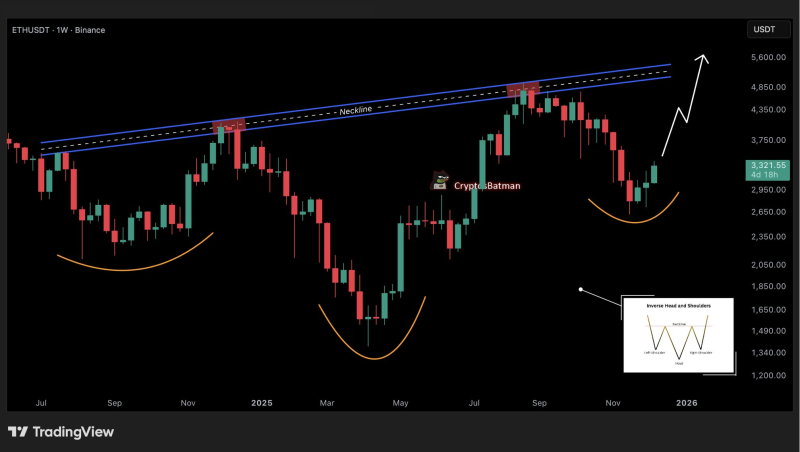
⬤ The pattern displays three separate lows. The head sits near $2,200; the right shoulder began at $2,650. A neckline stretches across the $4,800-$4,900 region. Weekly candles trace the climb. Fresh buying keeps the price aligned with the broader setup. A close above the neckline would finish the pattern.
⬤ Chart measurement points to a target in the mid-$5,000 area. The height of the formation sets the distance of the expected follow through. Weekly momentum has improved - a test of the neckline is likely.
⬤ A successful break would signal renewed strength in Ethereum's multi month advance and would probably lift sentiment across the wider crypto market. Traders now wait to see if the months long structure is ready to trigger.
 Peter Smith