 Marina Lyubimova

⬤ Ethereum is under fresh pressure because the long term floor that formed between 2022 and 2025 now shows cracks. The base weakens plus traders fear that a break below it will repeat the collapse seen in earlier cycles. On the weekly chart the price keeps getting rejected between $3,500 and $4,000 and the rising trendline that once held the market up is close to giving way.
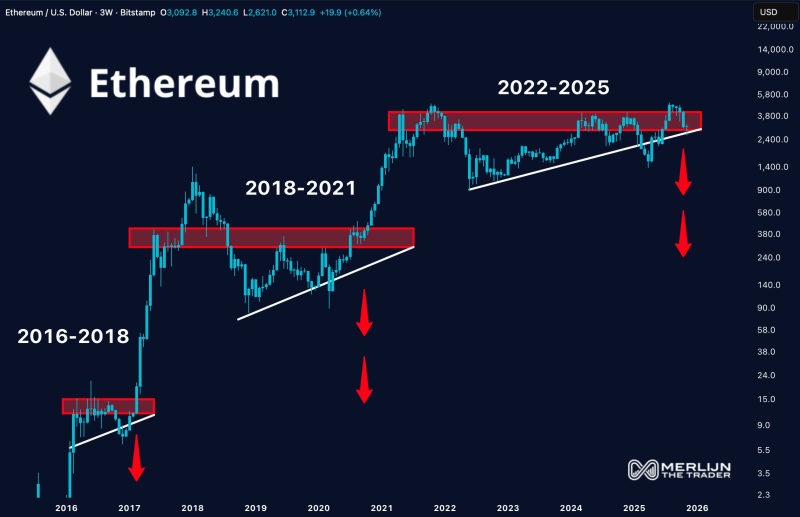
⬤ History supplies the context. The chart shows three long sideways periods: 2016 - 2018, 2018 - 2021 but also the present 2022 - 2025 stretch. In the first two Ethereum built a rising floor under a ceiling then crashed once that floor failed. The latest pattern matches the script - price cannot stay above $3,500 - $4,000 and now drifts toward the rising support line.
The current base is showing signs of strain raising concern that a breakdown could follow the same structural behavior observed in earlier cycles.
⬤ Price action across those cycles shows how the pattern repeats as well as shapes mood. After each multi year grind and repeated tests of the ceiling, the eventual break lower produced deep pullbacks. Today the picture looks the same - rallies fade inside the $3,500 - $4,000 zone or new weakness appears. Ethereum's failure to hold the structure draws attention as a possible signal for the wider crypto market.
⬤ The stakes are high because Ethereum serves as a key liquidity gauge for digital assets. When long term structure fails, sentiment across the crypto market shifts. If the 2022 - 2025 floor gives way, the prior cycle pattern will complete and risk appetite, capital flows also volatility will all feel the effect in the months ahead.
 Marina Lyubimova


