 Usman Salis

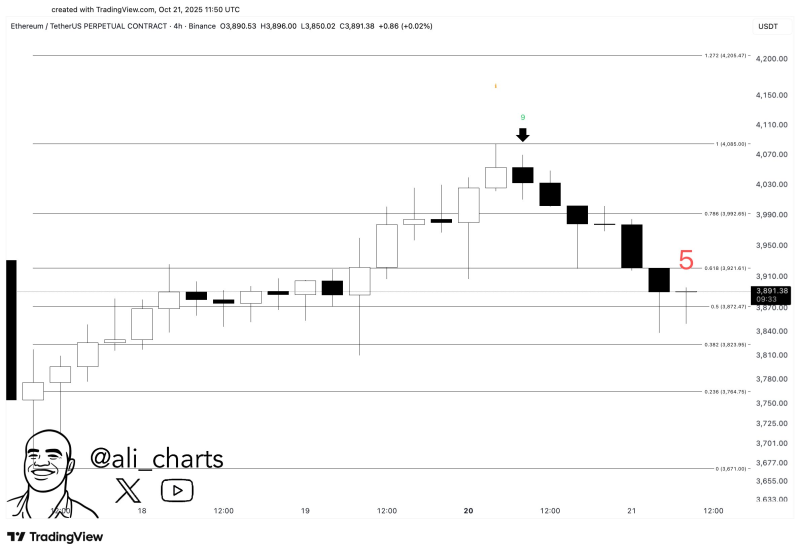
● The TD Sequential indicator nailed Ethereum's latest pullback. His TradingView chart showed ETH hitting resistance around $4,085, where a classic TD "9" sell setup formed, followed by five candles of decline that dragged the price below $3,900.
● As Ali put it: "TD called it perfectly! Ethereum has now retraced below $3,900." It's a clear example of how ETH's short-term moves are following technical patterns pretty closely. On the 4-hour timeframe, the pullback landed right at the 0.618 Fibonacci level ($3,921), with the next support targets sitting around $3,827 and $3,823.
● The big question now is whether Ethereum can hold these levels as selling pressure builds. If ETH breaks decisively below $3,820, we could see a deeper slide toward $3,746—potentially marking a local top and triggering liquidations among over-leveraged longs. Some analysts are warning that losing this zone could shake short-term confidence and pull capital out of ETH futures.
● From a trading perspective, if Ethereum steadies here, it could set up a base for another push toward $3,992 and eventually $4,085—the key resistance before any run at $4,205. On the flip side, a drop below $3,750 would likely stall the bullish momentum and squeeze short-term profits.
● This pullback comes after weeks of solid gains across the altcoin market. Despite the correction, Ethereum's underlying structure still looks healthy, backed by strong volume, continued institutional interest, and steady inflows.
 Usman Salis


